KAS Bank N.V.-German Branch für die Anleihe der Exporo Hannover GmbH-keine neuen Bilanzen-letzte hinterlegte Bilanz aus dem Jahre 2009
Natürlich schaut man sich dann auch einmal die wichtigen Partner der EXPORO Hannover GmbH einmal etwas genauer an. Hier zum Beispiel die Zahlstelle. Hierzu heißt es im Prospekt: Zitat:1. Zahlstelle
- Zahlstelle ist die KAS BANK N.V. – German Branch mit dem Sitz in Frankfurt am Main (die
„Zahlstelle“). Die Zahlstelle ist berechtigt, sich der Dienste Dritter zu bedienen und/oder Aufgaben an Dritte zu übertragen. Die Zahlstelle in ihrer Eigenschaft als solche handelt ausschließlich als Beauftragte der Emittentin und steht nicht in einem Auftrags- oder Treuhandverhältnis zu den Anleihegläubigern. Die Zahlstelle ist von den Beschränkungen des § 181 BGB befreit.
- Die Emittentin wird dafür Sorge tragen, dass stets eine Zahlstelle vorhanden ist. Die Emittentin ist berechtigt, andere Banken als Zahlstelle zu bestellen. Die Emittentin ist weiterhin berechtigt, die Bestellung einer Bank als Zahlstelle zu widerrufen. Im Falle einer solchen Abberufung oder falls die bestellte Bank nicht mehr als Zahlstelle tätig werden kann oder will, bestellt die Emittentin eine andere Bank als Zahlstelle. Die Bestellung einer anderen Zahlstelle ist von der Emittentin unverzüglich gemäß Ziff. 11 bekannt zu
Zitat Ende
Geht man dann einmal, wie wir, ins Unternehmensregister, dann findet man dann auf en ersten Blick keine neue (aktuelle) hinterlegte udn öffentlich zugängliche Bilanz. Erst wenn man dann ein Häkchen in „auch gelöschte Firmen macht“ wird das Suchergebnis dann etwas größer. Hier findet man dann als letzte hinterlegte Bilanz eine Bilanz aus dem Jahre 2009, aber auch wenn man in den „Bezahlbereich geht“ findet man auch dort keine Bilanzen. Diese nachfolgende Bilanz dann zu BEWERTEN macht wenig Sinn, denn dafür ist die Bilanz einfach zu alt.
KAS BANK N.V. – German Branch
Wiesbaden
Jahresabschluss zum 31. Dezember 2009
Five years in figures KAS BANK N.V.
| Consolidated, in millions of euros | 2009 | 2008 | 2007 | 2006 | 2005 |
| Equity attributable to equity holders of the bank | 193.4 | 167.5 | 254.9 | 217.6 | 207.8 |
| Own funds | |||||
| (Equity attributable to equity holders of the bank plus subordinated liabilities) | 193.4 | 167.5 | 266.3 | 247.1 | 237.3 |
| Total assets | 6,329.7 | 7,360.2 | 8,371.8 | 6,448.5 | 7,774.0 |
| Income | |||||
| Net interest | 30.6 | 28.9 | 21.6 | 16.8 | 23.3 |
| Net commission | 75.3 | 89.2 | 93.4 | 83.3 | 77.7 |
| Result on investments | 28.9 | 10.9 | 32.9 | 28.5 | 19.1 |
| Other income | 2.0 | 0.6 | 26.2 | 1.7 | 0.4 |
| Total income | 136.8 | 129.6 | 174.1 | 130.3 | 120.5 |
| Operating expenses | 105.3 | 108.2 | 102.1 | 94.2 | 93.3 |
| Impairment losses | -0.3 | 73.4 | 4.7 | – | – |
| Total operating expenses | 105.0 | 181.6 | 106.8 | 94.2 | 93.3 |
| Result for the period before tax | 31.8 | -52.0 | 67.3 | 36.1 | 27.2 |
| Result for the period attributable to equity holders of the bank | 24.6 | -39.9 | 50.9 | 26.6 | 19.4 |
| Figures per share of C1.00 nominal value (in eu ros) | |||||
| Net asset value after proposed dividend | 13.27 | 11.49 | 14.19 | 13.65 | 13.55 |
| Basic earnings per share | 1.69 | -2.70 | 3.41 | 1.79 | 1.32 |
| Dividend | 0.73 | 0.45 | 2.60 | 1.40 | 1.00 |
| Share price, high | 14.40 | 29.30 | 29.69 | 23.15 | 19.10 |
| Share price, low | 6.95 | 9.45 | 20.49 | 18.66 | 15.11 |
| Share price, year-end | 14.05 | 9.90 | 25.00 | 20.85 | 18.70 |
| Ratios (%) | |||||
| Net return on average shareholders‘ equity | 13.7 | -20.2 | 23.7 | 13.2 | 9.7 |
| Efficiency ratio (operating expenses/income) | 79 | 81 | 76 | 77 | 77 |
| Growth in basic earnings per share (%) | 162 | -179 | 91 | 36 | 21 |
| BIS ratio (average) * | 21 | 15 | 16 | 17 | 17 |
* The BIS ratios for the years 2005-2007 are based on Basel I. The BIS ratios for 2008 and 2009 are based on Basel II.
ANNUAL REPORT 2009
The annual report and accounts have been prepared in the Dutch language. This document is a translation.
Where differences arise between the English and Dutch texts, the latter takes precedence.
Profile of KAS BANK N.V.
KAS BANK N.V. is a European specialist in securities services, connecting professional financial institutions across the globe. From its primary services of investment administration, custody, clearing and settlement, value-added services have evolved in the field of treasury, risk control and management information.
KAS BANK pursues a ‚pure play‘ strategy: it does not provide active asset management services itself and is independent. Its neutrality precludes conflicts of interest with its clients and guarantees its impartiality and autonomy. A low risk profile is integral to its services.
As an independent specialist, we view the market from the perspective of our clients: institutional investors (pension funds, insurance companies, investment funds and asset managers) and financial institutions (banks and brokers). Our clients are based all over Europe; the Netherlands, Germany and the United Kingdom are our core markets.
Mutual trust and absolute transparency are fundamental to our services and to our relationship with our clients. Outsourcing their administrative functions to KAS BANK enables our clients to focus primarily on their own core services. Client focus and operational excellence are crucial: the client and the faultless processing on which the client depends are paramount. This is achieved by combining a proactive approach with advanced information technology and optimum process control. KAS BANK uses a single central technology platform for all European markets with which it has direct connections.
KAS BANK has offices in Amsterdam, London and Wiesbaden and employs around 800 staff. Founded in 1806, it has been listed on the NYSE Euronext Amsterdam stock exchange since 1986.
Contents
Personal notes
Information for shareholders
Report of the Supervisory Board
Report of the Managing Board
Financial statements
| • |
Consolidated income statement |
| • |
Consolidated statement of comprehensive income |
| • |
Consolidated balance sheet |
| • |
Consolidated statement of changes in equity |
| • |
Consolidated statement of cash flows |
| • |
Accounting policies |
| • |
Notes to the consolidated income statement |
| • |
Notes to the consolidated balance sheet |
| • |
Notes on off-balance-sheet commitments and contingent liabilities |
| • |
Risk management |
| • |
Segment information |
| • |
Share-based payments and related parties |
| • |
Auditors‘ fees |
| • |
Company income statement |
| • |
Company balance sheet |
| • |
Notes to the company financial statements |
| • |
Management declaration and signature |
Other information
| • |
Appropriation of result for 2009 |
| • |
Auditors‘ report |
Various reports and statements
| • |
Report of Stichting Administratiekantoor Aandelen KAS BANK (KAS BANK Registrar’s office) |
| • |
Report of Stichting Administratiekantoor Aandelen KAS BANK Effectenbewaarbedrijf (KDTC Registrar’s Office) |
| • |
Report of Stichting Administratiekantoor Aandelen KAS BANK Derivaten Clearing (KASDC Registrar’s Office) |
Corporate governance
Personal notes
Situation as at 3 March 2010
Supervisory Board
D.J.M.G. Baron van Slingelandt (1946), chairman
J.M.G. Frijns (1947), vice-chairman
C. Griffioen (1941)
A.H. Lundqvist (1945)
R.A.H. van der Meer (1949)
H. Donkervoort (1953)
| D.J.M.G. Baron van Slingelandt, chairman | |
| Profession/current principal position | : None |
| Previous principal position | : Member of the Executive Board of Rabobank Nederland and Chairman of the Managing Board of Rabobank International |
| Other positions | : Member of the Supervisory Board of IHC Merwede Holland B.V. and Redevco Europe Services B.V. |
| First appointed | : 2007 |
| Current term of office expires | : 2011 |
| J.M.G. Frijns, vice-chairman Profession/current principal position | : Endowed Professor of Investment Theory at Amsterdam Free University |
| Previous principal position | : Chief Investment Officer and member of the Board of Directors of Pensioenfonds ABP |
| Other positions | : Member of the Supervisory Board of IMC International Marketmakers B.V. and Bouwinvest B.V.; member of the Board of Directors of JP Morgan Funds (Luxembourg) and Rabo Ledencertificaten N.V.; member of the investment committee of PFZW and the Advisory Board of the Norwegian government pension fund; chairman of the Corporate Governance Code Monitoring Committee (until June 2009) |
| First appointed | : 2008 |
| Current term of office expires | : 2012 |
| C. Griffioen | |
| Profession/current principal position | : None |
| Previous principal position | : Member of the Executive Board and CFO of Koninklijke KPN N.V. |
| Other positions | : Vice-chairman of the Supervisory Board and chairman of the Audit Committee of N.V. Nederlandse Gasunie; vice-chairman of the Supervisory Board of Berenschot Holding B.V.; vice-chairman of the Board of Trustees of Zorggroep Noorderbreedte; member of the Supervisory Board and chairman of the Audit Committee of Tennet Holding B.V.; advisory member of the Managing Board of Deloitte. |
| First appointed | : 1998 |
| Current term of office expires | : 2010 |
| A.H. Lundqvist Profession/current principal position | : Chairman of the Executive Board of Eindhoven University of Technology |
| Previous principal position | : CEO of IBM Nederland N.V. |
| Other positions | : Chairman of the Supervisory Board of Generali Verzekeringsgroep N.V., Surfnet B.V. and Surfdiensten B.V.; member of Supervisory Board of TIAS-Nimbas Business School; chairman of the Board of Trustees of St. Anna Zorggroep; member of the Science and Technology Policy Advisory Council. |
| First appointed | : 2001 |
| Current term of office expires | : 2013 |
| R.A.H. van der Meer Profession/current principal position | : Professor of Finance at Groningen University; General Manager of P&C B.V./Lesuut Finance B.V. |
| Previous principal position | : Member of the Executive Board of Fortis. |
| Other positions | : Chairman of the Supervisory Board of BNP Paribas Obam, Stadsherstel Den Haag N.V. and vice-chairman of Corio N.V.; member of the Supervisory Board of European Asset Trust N.V., Robein Leven N.V. and J.P. Morgan (SICAV) and Teslin Capital Management N.V.; member of the DSI Arbitration Commission; deputy member of the Enterprise Section of the Amsterdam Court of Appeal. |
| First appointed | : 2005 |
| Current term of office expires | : 2013 |
| H. Donkervoort Profession/current principal position | : Chairman of the Board of Trustees of ROC Drenthe College |
| Other positions | : General Manager of ID Management & Advies B.V.; member of the Supervisory Board of Stichting Woonborg; member of the Executive Committee of Stichting Technomatch; member of the Programme Committee of Samenwerkingsverband Noord-Nederland; member of the Board of Trustees of Jeugdhulp Friesland. |
| First appointed | : 2006 |
| Current term of office expires | : 2010 |
The members of the Supervisory Board are Dutch nationals.
Managing Board
A.A. Röell (1959), chairman
R.J. Kooijman (1961), Chief Financial Officer
N.E. Blom (1962), Chief Operating Officer
S.A.J. van Katwijk (1964), Chief Commercial Officer (since 1 July 2009)
Managing Director
L.G. Vis
Assistant Managing Director
H. Brink
Chief Risk Officer
K. Wulteputte
Internal auditor
J. Voskuilen
Secretary to the Managing Board
M.G.F.M.V. Janssen
Dear shareholder,
2009 was an unusual year for the financial world in many respects. With central government support, in breadth and often in depth, the markets recovered sufficiently to justify the assertion that a complete system meltdown had been successfully averted. Many banks are now reconsidering their position, often in company with other financial institutions, rating agencies and supervisory and regulatory authorities. But what will the future bring?
The past year revealed that the large and internationally active banks were not always flexible enough to avoid a systemic crisis. Their solvency was eroded by movements in the value of structured financial products and writedowns on business loans, compounded by the devaluation of their real estate portfolios, while the banks‘ action to lower their debt levels shrank their balance sheets. Tighter conditions put the brakes on lending to the private sector in the eurozone, while the region’s banking sector received generous liquidity support from the European system of central banks.
KAS BANK weathered the storm weII. Although the more cautious stance adopted by the financial industry in the face of this uncertainty translated into lower revenues, the bank responded effectively and ended 2009 in profit. The acquisition of Deutsche Postbank’s investment management company in mid-2009 has strengthened our position in Germany and demonstrated that KAS BANK is able to stay firmly on course, even in difficult times – and without recourse to government support or the capital market.
The choice on the market is less a question of big or small and more one of specialised or diversified. Our positioning as a’pure player‘, a wholesale bank with a business model that combines client focus and a high degree of specialisation, continued to prove its worth during the crisis.
A cautious start has been made on rebuilding, in response to the public’s demand for a cultural change within the financial sector. New regulations are being developed, designed to ensure that such a situation never arises again. Meanwhile, the international aspect is becoming increasingly dominant, as is evident for example from the activities of the G20 countries and the reports and directives issued by the European Union.
We are well aware that public confidence in the banks has been shaken by the credit crisis. KAS BANK is working hard to make a substantive contribution to restoring trust in the financial industry. In that context, we endorse the initiatives being undertaken in the field of regulation and supervision and, as from 1 January 2010, we have implemented virtually unchanged the Banking Code that complements the Dutch corporate governance code.
We thank our shareholders, our clients and our staff for their confidence in the bank.
Amsterdam, 3 March 2010
KAS BANK N.V.
A.A. Röell, Chairman of the Managing Board
Information for shareholders
Attendance at the General Meeting of Shareholders
The shareholders and depositary receipt holders attending the General Meeting of Shareholders on 22 April 2009 represented well over 50% of the votin g capital (66%). Stichting Administratiekantoor Aandelen KAS BANK (‚KAS BANK Registrar’s Office‘), acting on behalf of holders of depositary receipts who did not attend the meeting in person, therefore represented less than 50% of the voting shares (34%). All depositary receipt holders attending the meeting were automatically given voting rights by KAS BANK Registrar’s Office. All resolutions at the meeting were adopted by acclamation.
Listing
The ordinary shares, in the form of depositary receipts, have been listed on the Official Market of the NYSE Euronext Amsterdam N.V. stock exchange since 1986. KAS BANK is included in NYSE Euronext’s Amsterdam Smallcap Index (AScX).
Dividend policy
In accordance with the dividend policy discussed with the General Meeting of Shareholders, our target is to distribute 60-80% of the net result, where the profit permits and unless prevented by exceptional ci rcu msta nces.
It is proposed that a dividend be declared for 2009 of €0.73 per ordinary share. An interim dividend of €0.33 per ordinary share already having been distributed, the final dividend, which will be payable in cash, will be €0.40.
5% holdings
The following institutions have given notification of holdings of 5% or more in KAS BANK, pursuant to the Financial Supervision Act and the Decree on Disclosure of Control and Major Holdings in Listed Companies.
| – Aviva plc | 12.7% |
| – APG Algemene Pensioen Groep N.V. | 8.8% |
| – Delta Deelnemingen Fonds N.V. | 8.6% |
| – ING Groep N.V. | 7.9% |
| – All Capital Holding B.V. | 5.3% |
| – KAS BANK N.V. | 5.1% |
Standard & Poor’s ‚A-‚ rating
KAS BANK was given an ‚A-‚ long-term rating and an ‚A-2′ short-term rating by Standard & Poor’s in 2009. The rating outlook was classed as ’stable‘. These ratings were confirmed by Standard & Poor’s in early 2010.
KAS BANK N.V. share price
Movements in the (indexed) price of KAS BANK depositary receipts over the past ten years are compared with the AEX Index in the graph on the next page.
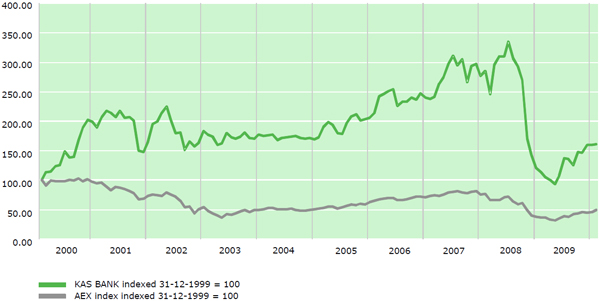
Figures per KAS BANK share
Over the past year, the price of KAS BANK shares rose by around 42% from €9.90 (at year-end 2008) to €14.05 (at year-end 2009). The basic earnings per KAS BANK share in 2009 were €1.69 (2008: €2.70 negative). On average, around 24,000 (2008: 14,000) KAS BANK shares were traded daily on NYSE Euronext Amsterdam in 2009. The figures per KAS BANK ordinary share can be found in the ÔFive years in figures‘ summary.
2010 financial calendar
| 4 March 2010 | – announcement of 2009 figures |
| – analysts‘ meeting | |
| 25 March 2010 | – publication of 2009 annual report |
| 21 April 2010 | – Annual General Meeting of Shareholders |
| – first-quarter 2010 figures | |
| 23 April 2010 | – ex-dividend quotation of KAS BANK N.V. depositary receipts |
| 27 April 2010 | – record date for determination of dividend entitlement |
| 5 May 2010 | – 2009 final dividend payable |
| 26 August 2010 | – publication of 2010 interim figures |
| – analysts‘ meeting | |
| 27 August 2010 | – ex-dividend quotation of KAS BANK N.V. depositary receipts |
| 31 August 2010 | – record date for determination of dividend entitlement |
| 8 September 2010 | – 2010 interim dividend payable |
| 3 November 2010 | – third-quarter 2010 figures |
2011 financial calendar
| 3 March 2011 | – announcement of 2010 figures |
| – analysts‘ meeting | |
| 24 March 2011 | – publication of 2010 annual report |
| 20 April 2011 | – Annual General Meeting of Shareholders |
| – first-quarter 2011 figures | |
| 22 April 2011 | – ex-dividend quotation of KAS BANK N.V. depositary receipts |
| 26 April 2011 | – record date for determination of dividend entitlement |
| 4 May 2011 | – 2010 final dividend payable |
| 25 August 2011 | – publication of 2011 interim figures |
| – analysts‘ meeting | |
| 26 August 2011 | – ex-dividend quotation of KAS BANK N.V. depositary receipts |
| 30 August 2011 | – record date for determination of dividend entitlement |
| 8 September 2011 | – 2011 interim dividend payable |
| 25 October 2011 | – third-quarter 2011 figures |
Report of the Supervisory Board
To the General Meeting of Shareholders
We hereby present the annual report and financial statements for the 2009 financial year, as prepared by the Managing Board. In this report, we inform you of the work of the Supervisory Board in 2009 and how we have supervised the bank’s policy and general course of affairs.
2009 financial statements
The Supervisory Board discussed the 2009 financial statements with the Managing Board and the external auditors. The 2009 financial statements have been examined by the external auditors KPMG Accountants N.V., whose unqualified report thereon can be found on page 116 of this annual report. We recommend that the General Meeting of Shareholders adopt the 2009 financial statements.
It is proposed that, in accordance with the company’s dividend policy, a dividend be declared for 2009 of €0.73 per ordinary share. An interim dividend of €0.33 per ordinary share already having been distributed, the final dividend, which will be payable in cash, will be €0.40.
We also propose that the members of the Managing Board be discharged of liability for their management and the members of the Supervisory Board for their supervision in 2009.
Corporate governance
Partly occasioned by the credit crisis, 2009 brought a large number of codes, recommendations and principles, including the revised Dutch corporate governance code (10 December 2008), the recommendations of the Maas Committee (‚Restoring trust‘), the Banking Code that evolved from them and two reports from the Nederlandsche Bank (DNB) and the Authority for the Financial Markets (AFM) entitled ‚Principles for sound compensation practices‘ and ‚Towards sound compensation practices‘. The Minister of Finance and the financial sector have entered into a ‚gentlemen’s agreement‘ and the administration has presented its vision of the sector’s future. The Supervisory Board discussed the Dutch corporate governance code and the Banking Code with the Managing Board and action has been taken to comply with the two codes.
As from 1 January 2010, the corporate governance code has been officially designated as the code of conduct with which all Dutch listed companies are to be bound. The bank’s status in terms of compliance with the updated code is discussed in the section ‚Corporate governance‘.
The Banking Code also came into effect on 1 January 2010. KAS BANK explains on its website the steps it has already taken to implement the Banking Code. Each year in its annual report, starting with the 2010 financial year, the bank will report on compliance with the principles of the Banking Code. The Minister of Finance has indicated that the statutory basis for the Banking Code will be made effective as from 1 January 2010.
KAS BANK has posted the full text of the corporate governance code and the Banking Code on its website, with explanatory notes appended to each best-practice provision.
Further information on the corporate governance ode and the Banking Code will be presented at the forthcoming General Meeting of Shareholders.
Composition of the Managing Board
Mr. R.J. Kooijman was appointed Chief Financial Officer (CFO) of KAS BANK with effect from 1 January 2009 and was appointed to the Managing Board by the Supervisory Board with effect from 22 April 2009.
Mr. S.A.J. van Katwijk was appointed as a member of the Managing Board and Chief Commercial Officer of KAS BANK with effect from 1 July 2009. Mr. Van Katwijk was appointed to the Managing Board to succeed Mr. Kadiks, who left the bank on 1 September 2009. The Supervisory Board owes Mr. Kadiks a special debt of gratitude for the contribution he made to KAS BANK’s further commercial development.
Meetings of the Supervisory Board
The Supervisory Board met with the Managing Board on nine occasions in 2009. Six of these meetings were scheduled and three were extra meetings. The Supervisory Board also met in the absence of the Managing Board on one occasion. All members of the Supervisory Board attended all the meetings.
One of the most important items on the agenda of all the meetings in 2009 was the risk-management programme initiated by KAS BANK in response to the events of 2008. The implementation of the programme was closely monitored by the Supervisory Board and is still included on the agenda of all its meetings. The FIRM system developed by the Nederlandsche Bank (DNB) is used for risk analysis and management. The FIRM system analyses the bank’s primary and secondary processes with reference to a framework covering the ten most significant risk categories for financial institutions. In the same context, the Supervisory Board also discussed the bank’s ICT structure in depth. The configuration and functioning of KAS BANK’s internal control and monitoring systems remain a priority issue for the Supervisory Board.
KAS BANK’s risk management and risk appetite were discussed at length and the bank’s low risk appetite was endorsed by Supervisory Board. The issue of risk appetite will be the subject of annual review at the Supervisory Board’s meetings.
The consequences of the credit crisis for KAS BANK were also debated extensively. The Supervisory Board discussed the company’s strategic development and plans and the risks associated with the company’s operations in the light of the credit crisis and the changed financial market. The Supervisory Board endorses the bank’s strategy, based on ‚pure play‘, neutrality, transparency and financial stability, and supports the bank’s ambition of European consolidation. The Supervisory Board and Managing Board evaluated several strategic scenarios, some of which were further developed, and the company’s capital structure was subjected to critical review. KAS BANK withstood the financial crisis without recourse to government support or the capital market.
The Supervisory Board discussed the financial results, the performance analyses, the reporting process in relation to targets and the budget and the sensitivity of the results to external circumstances. The financial statements, the annual analysis and the management letter were considered in the presence of the external auditors. The early publication of the full-year figures for 2008 in connection with additional impairment losses on the investment portfolio was discussed within the Board.
Other important items on the agenda included the composition of the Managing Board and the Supervisory Board and the preparation of the new remuneration policy for the Managing Board which is to be submitted to the shareholders for approval in April 2010. Strengthening the structure of the first management echelon was also discussed. The new Chief Commercial Officer presented his commercial plans at several meetings. The agenda also included the acquisition of Deutsche Postbank’s investment management company and the reports of the rating agencies and analysts.
Lastly, a number of presentations were given to the Supervisory Board by senior management, including presentations on social policy and personal development, Global Fund Services and risk management and the bank’s risk appetite.
At the meeting held in the absence of the Managing Board, the Supervisory Board discussed its membership profile, its own functioning and that of the Managing Board and the relationship between the Supervisory Board and the Managing Board. The functioning of the Supervisory Board and its committees was subjected to a critical review in the light of the credit crisis and the pressure on financial institutions, not least in respect of their supervision. The Supervisory Board conducted a self-assessment and concluded that there was scope for strengthening the board in some areas, which will be addressed in the membership profile, but the outcome of the assessment was generally positive. The functioning of the Managing Board was also given a favourable review. Agreement was reached on a point of concern in the relationship between the two boards, namely communication on the human resources aspect of the business.
Members of the Supervisory Board attended two consultation meetings of the Employees‘ Council at which the bank’s general state of affairs, its results and other developments were discussed.
There was regular contact outside the plenary meetings, both between the chairmen of the Supervisory Board and Managing Board and between the other members.
Principles of remuneration policy/remuneration report
The current remuneration policy for the Managing Board, which was adopted and approved by the General Meeting of Shareholders in 2007, is posted on KAS BANK’s website. The remuneration of the individual members of the Managing Board is set by the Supervisory Board on the recommendation of the Appointments and Remuneration Committee, which is assisted by KAS BANK’s Internal Audit department in determining the components of the variable remuneration.
The current fixed salary is based on the salaries paid by a basket of some 30 companies that are comparable with KAS BANK in terms of operating region (Netherlands and Europe) and size. The fixed salary lies between the median and third quartile and is reviewed every two years in the light of developments in the market.
A review in 2009 was deferred in connection with the credit crisis.
There was no review of the fixed salaries of the members of Managing Board in 2009 and they were not reviewed for 2010. The fixed annual salary of the chairman of the Managing Board has remained at €350,000 since 1 January 2008. The fixed annual salary of the other members of the Managing Board is between €225,000 and €250,000.
The annual short-term variable remuneration of the Managing Board is determined with reference to a number of performance criteria set by the Supervisory Board. Of these criteria, 70% are quantitative, in the form of KAS BANK’s external financial targets, and 30% are qualitative, relating to operating performance and strategic policy. The quantitative criteria include the growth in income versus the growth in expenses, the efficiency ratio, the return on equity and the growth in earnings per share. In addition to the performance criteria, an individual criterion is also applied, based on the performance of each individual member of the Managing Board.
The performance criteria are selected such that they do not encourage members of the Managing Board to act in their own interests or take risks that are inconsistent with the approved strategy.
The criteria for ‚at target‘ performance are above the lower limit of the external targets and above the operating results for the previous year. The ‚at target‘ percentages of the fixed income for the short-term variable remuneration are 40% for the chairman and 30% for the other members of the Managing Board.
The bank ended 2009 with an improved result, higher operating profit and a strong balance sheet. Operating expenses were 3% lower, despite the consolidation of an acquisition in Germany and the cost of its integration into the organisation. The bank responded effectively to developments on the European capital markets with its interest and investment policy. As for the quantitative criteria, the growth in operating income was 2.4% higher than the growth in operating expenses, the efficiency ratio fell from 81% to 79% and earnings per share were 13% higher, which translated into a return on equity of 12% or a premium of 8.3% over the return on ten-year government loans. The qualitative criteria for 2009 focused principally on risk management and accounting organisation and on these criteria the Managing Board outperformed the targets by a substantial margin.
Based on the results measured against the quantitative and qualitative criteria, the chairman of the Managing Board has been awarded short-term variable remuneration for 2009 in accordance with the remuneration system of 48.4% of his fixed salary. The CFO has been awarded short-term variable remuneration for 2009 of 39.9% of his fixed salary and the other members of the Managing Board 36.3% of their fixed salary.
In accordance with the contract with Mr. Kadiks, the percentage for this former Managing Board member for 2009 was 92.6% for the period to the end of August 2009. Mr. Kadiks qualified for higher short-term variable remuneration because his contract made no provision for long-term variable remuneration.
The long-term variable remuneration does not become unconditional for three years. The long-term variable remuneration is calculated on the basis of the average growth in earnings per share over three years. ‚At target‘ performance is defined as average growth in earnings per share of 10% per year over a period of three years. If ‚at target‘ performance is achieved, the chairman of the Managing Board receives 50% of his fixed gross annual salary and the members of the Managing Board receive 40% of their fixed gross annual salary in the form of performance shares and options. Extraordinary income and expenses are not included.
Given the exceptionally poor results in 2008, no long-term variable remuneration would be payable in respect of the periods 2007-2009 and 2008-2010. The Supervisory Board takes the view that, given the extraordinary circumstances that prevailed in 2008, this would give rise to an inequitable situation in which the Managing Board would not qualify for long-term variable remuneration for a number of years. The new remuneration policy for the Managing Board provides a more balanced system of long-term variable remuneration and in particular takes better account of possible (extreme) excursions in the result, both upwards and downwards. The Supervisory Board also intends to apply the new remuneration policy to the current three-year period for the incumbent members of the Managing Board. This will result in an equitable and realistic outcome for the Managing Board over those periods.
Under the agreed pension plan for the Managing Board, which is a defined-contribution (DC) scheme, a fixed contribution of 24.9% was paid into each member’s pension and life-course savings plan. The company also bore the cost of term life insurance and incapacity benefit insurance for members of the Managing Board. The expense allowance scheme for the Managing Board has been abolished.
A change-of-control clause has been agreed with the two new members of the Managing Board, under which they are entitled to one year’s salary in the event of a change of control. This clause will also be included in the contracts with the other members of the Managing Board.
The remuneration report by the Supervisory Board has been posted on the company’s website. The report explains how the remuneration policy has been applied in practice in the past year and provides an overview of the proposed remuneration policy for the coming years.
A revised remuneration policy for the Managing Board for 2010 has been placed on the agenda of the Annual General Meeting of Shareholders on 21 April 2010.
Composition of the Supervisory Board
The Supervisory Board consists of six members. All the members of the Supervisory Board are independent within the meaning of the corporate governance code and none is a former member of the Managing Board. The members of the Supervisory Board receive no profit-related remuneration. None of the members of the Supervisory Board holds KAS BANK shares or options.
The Supervisory Board has formulated a membership profile that defines its size and composition. The membership profile for the Supervisory Board was discussed at the General Meeting of Shareholders in 2004 and 2005 and is posted on the company’s website. A properly constituted Supervisory Board should encompass knowledge of or experience or familiarity with information and communications technology, accounting organisation, national and international banking, securities and derivatives, social policy, national and international business, the workings of institutional investors and financial institutions and the (European) securities industry.
The duties and procedures of the Supervisory Board are defined in by-laws, which are posted on the company’s website.
The members of the Supervisory Board retire by rotation. Messrs. R.A.H. van der Meer and A.H. Lundqvist were due to retire from the Supervisory Board by rotation at the end of the 2009 General Meeting of Shareholders. Both offered themselves for reappointment.
On the nomination of the Supervisory Board, Messrs. Van der Meer and Lundqvist were reappointed as members of the Supervisory Board, both for a term of four years. No other candidates were nominated by the General Meeting of Shareholders.
Mr. C. Griffioen and Ms. H. Donkervoort are due to retire by rotation from the Supervisory Board at the end of the General Meeting of Shareholders on 21 April 2010. Mr. Griffioen is not eligible for reappointment, having completed the maximum term of 12 years. Ms. Donkervoort has not offered herself for reappointment.
Committees formed by the Supervisory Board
The Supervisory Board has formed three committees: the Risk Management Supervision Committee, the Audit Committee and the Appointments and Remuneration Committee. The task of the committees is to prepare for decision-making by the Supervisory Board.
The Risk Management Supervision Committee is responsible for supervising the Managing Board with regard to all banking-related aspects of the company’s internal risk control and monitoring systems, including credit risks, liquidity risks, market risks and operating risks. The Risk Management Supervision Committee met on three occasions in 2009. The main items on the agenda were the status of the risk management programme, ICAAP reporting, business continuity management and credit reporting. In the context of the risk management programme, discussions were held interalia on the policy plans for the various risk management programmes and their implementation.
The Risk Management Supervision Committee consists of three members of the Supervisory Board: Messrs. R.A.H. van der Meer (chairman), D.J.M.G. Baron Van Slingelandt and J.M.G. Frijns.
The Audit Committee is responsible for supervising the Managing Board with regard to all accounting-related aspects of the company’s internal risk control and monitoring systems, focusing in particular on the quality, integrity and selection of the financial information provided by the company, the role and functioning of the Internal Audit department, the relationship with the external auditors, with particular reference to their independence, and the bank’s ICT security. The Audit Committee met four times in 2009. The main items on the agenda were the annual and interim reporting, the loss analyses and the budget for the coming year. The Audit Committee consists of three members of the Supervisory Board: Messrs. C. Griffioen (chairman), R.A.H. van der Meer and A.H. Lundqvist.
The Appointments and Remuneration Committee is responsible for defining the selection criteria and appointment procedures for members of the Supervisory Board and Managing Board and carrying out preliminary work in connection with appointments and reappointments to the Managing Board and Supervisory Board. The committee also submits proposals to the Supervisory Board relating to the remuneration policy and the remuneration of the individual members of the Managing Board. The Appointments and Remuneration Committee held six meetings in 2009, at which the business transacted included the preparation of proposals for the appointment of the new members of the Managing Board and Supervisory Board, the remuneration of the members of the Managing Board, preparations for a new remuneration policy for the Managing Board and the pension plan for the Managing Board members.
The Appointments and Remuneration Committee consists of three members of the Supervisory Board: Messrs. A.H. Lundqvist (chairman) and D.J.M.G. Baron van Slingelandt and Ms. H. Donkervoort.
The minutes of all the meetings of the committees are submitted to the Supervisory Board, on the basis of which the chairman of each committee reports on its deliberations, findings and recommendations.
Amsterdam, 3 March 2010
The Supervisory Board:
D.J.M.G. Baron van Slingelandt, chairman
J.M.G. Frijns, vice-chairman
C. Griffioen
A.H. Lundqvist
R.A.H. van der Meer
H. Donkervoort
Report of the Managing Board
2009 results
The operating profit rose 12% in 2009 to €21.0 million (2008: €18.8 million), mainly driven by a €2.8 million (3%) reduction in operating expenses. Operating income in 2009 remained very close to the 2008 level at €132.0 million (2008: €132.3 million).
The effect of exceptional items on the result in 2009 was €3.6 million positive (2008: €58.7 million negative) and consisted mainly of capital gains on securities which had been subject to impairment in prior years. Including exceptional items, the result in 2009 was €24.6 million positive (2008: €39.9 million negative).
In July 2009, KAS BANK acquired Deutsche Postbank Privat Kapitalanlagegesellschaft mbH, which was fully integrated into KAS Investment Servicing GmbH in the fourth quarte r of 2009. Deutsche Privat Kapitalanlagegesellschaft mbH made a positive contribution to profit in 2009.
On the basis of the operating result, the return on equity in 2009 was 12% (2008: 9%) and the operating efficiency ratio was 79% (2008: 81%).
Capital adequacy
KAS BANK’s focus on a low risk profile is reflected in the quality of the balance sheet and the relatively high BIS ratio, which averaged 21% in 2009 (2008: 15%). As at year-end 2009, the BIS ratio was 24% (2008: 18%) and the Tier 1 ratio was 21% (2008: 15%).
Dividend
The Managing Board will propose to the General Meeting of Shareholders, with the approval of the Supervisory Board, that a final dividend be declared of €0.40 in cash per KAS BANK ordinary share. Including the interim dividend of €0 .33, this will bring the total dividend per ordinary share for 2009 to €0.73 (2008: €0.45 per ordinary share). It is KAS BANK’s policy to fund small acquisitions, such as that of Deutsche Postbank Privat Investment Kapitalanlagegesellschaft mbH, from the profit for the financial year concerned. The dividend of €0.73 per ordinary share has been determined on the basis of a pay-out ratio of 61% of the operating profit, after adjustment for the investment in the intangible assets of the recent acquisition.
Operating income
Operating income in 2009 showed little change at €132.0 million (2008: €132.3 million). Lower commission income was offset by higher interest and other income.
| (in millions of euros) | 2009 | 2008 | change | % |
| Interest | 30.7 | 28.9 | 1.8 | 6% |
| Commission | 75.3 | 89.2 | -13.9 | -16% |
| Result on investments | 24.0 | 13.5 | 10.5 | 78% |
| Other income | 2.0 | 0.7 | 1.3 | |
| Operating income | 132.0 | 132.3 | -0.3 | 0% |
| Exceptional income | 4.9 | -2.7 | 7.6 | |
| Total income | 136.9 | 129.6 | 7.3 | 6% |
Interest income was 6% higher at €30.7 million (2008: €28.9 million), driven by a wider interest spread in the first half of 2009, mainly on government-guaranteed bonds. These were swapped for a 3-month interest rate, to take advantage of the relatively wide credit spreads.
Commission income was 16% lower at €75.3 million (2008: €89.2 million), largely due to the decline in commission income from securities lending in the wake of the financial crisis and the deteriorating market conditions since the fourth quarter of 2008. Excluding securities lending, commission income was only 3% lower. The change in commission income is analysed by source below.
| (in millions of euros) | 2009 | 2008 | change | % |
| Custody and investment management services | 30.1 | 28.7 | 1.4 | 5% |
| Clearing and settlement | 33.8 | 37.6 | -3.8 | -10% |
| Other | 6.3 | 5.7 | 0.6 | 11% |
| Subtotal | 70.2 | 72.0 | -1.8 | -3% |
| Securities lending | 5.1 | 17.2 | -12.1 | -70% |
| Total commission income | 75.3 | 89.2 | -13.9 | -16% |
The acquisition of Deutsche Postbank Privat Kapitalanlagegesellschaft mbH helped to boost income from custody and investment management services. Lower transaction volumes were partly responsible for the decline in commission income from clearing and settlement. The development of new services helped to drive the growth in other commission income.
The result on investments is analysed in the table below.
| (in millions of euros) | 2009 | 2008 | change | % |
| Trading – foreign-exchange transactions | 11.7 | 12.1 | -0.4 | -4% |
| Trading – securities and derivatives | 2.4 | -0.4 | 2.8 | |
| Investments – investment portfolio | 9.9 | 1.8 | 8.1 | |
| Result on investments – normal operations | 24.0 | 13.5 | 10.5 | 77% |
| Result on investments – exceptional | 4.9 | -2.7 | 7.6 | |
| Total result on investments | 28.8 | 10.8 | 18.0 |
The result on investments in normal operations was €10.5 million higher at €24.0 million. The increase can be attributed mainly to gains on the sale of bonds and, to a lesser extent, equities from the investment portfolio. Lower market interest rates in the second half of 2009 exerted some pressure on interest income.
The exceptional result on investments rose €7.6 million to €4.9 million (2008: €2.7 million negative), of which €4.3 million related to gains on bonds which had been subject to impairment the year before. The capital gain on the sale of the shareholding in NYSE/Euronext (€1.5 million) is accounted for as an excepti onal result.
Lastly, there was a €1.1 million negative (2008: €2.7 million negative) effect on the exceptional result from the impairment of a derivative. This charge has been treated as an exceptional item because the corresponding item is recognised in equity under IFRS.
Operating expenses
Operating expenses are analysed in the table below.
| (in millions of euros) | 2009 | 2008 | change | % |
| Staff costs | 67.3 | 70.1 | -2.8 | -4% |
| Premises costs | 3.4 | 3.6 | -0.2 | -7% |
| ICT costs | 14.7 | 16.1 | -1.4 | -9% |
| General overheads | 11.0 | 9.6 | 1.4 | 15% |
| Depreciation/amortisation | 8.1 | 7.9 | 0.2 | 3% |
| Total operating expenses – normal operations | 104.5 | 107.3 | -2.8 | -3% |
| Operating expenses – exceptional | 0.8 | 0.9 | -0.1 | -11% |
| Total operating expenses | 105.3 | 108.2 | -2.9 | -3% |
Reduced usage of external temporary staff and lower pension charges were largely responsible for the lower staff costs in 2009. ICT costs were lower mainly due to the completion of a number of projects for which the majority of the expense was recognised in 2008. The increase in general ove rheads chiefly reflects higher consultancy costs.
The exceptional operating expenses in 2009 relate to the formation of a provision for KAS BANK’s contribution to the DSB deposit guarantee scheme (€0.8 million).
Impairment losses
A net €0.3 million positive (reversal) was recognised in impairment charges in 2009. Impairment losses of €73.4 million, due partly to the financial crisis, were recognised in 2008.
Investment portfolio quality
Both the securities in the available-for-sale portfolio and the investments at fair value through profit or loss are analysed by credit rating (Moody’s Investor Services) in the table below.
| (in millions of euros) | 31-12-2009 | Percentage of portfolio | 31-12-2008 | Percentage of portfolio |
| Aaa-Aa 3 | 1,339 | 93% | 537 | 75% |
| A1-A3 | 37 | 2% | 35 | 5% |
| Baa 1-Baa 3 | 40 | 3% | 10 | 1% |
| P1-P2 | 0 | 0% | 100 | 14% |
| Shares | 28 | 2% | 33 | 5% |
| Total | 1,444 | 100% | 715 | 100% |
The increase of €729 million in the investment portfolio to €1,444 million is largely a product of KAS BANK’s policy of converting part of its cash and cash equivalents into triple-A securities. As at year-end 2009, 93% of the investments had a rating of Aa3 or higher (year -end 2008: 75%).
Risk-weighted value of the assets
KAS BANK’s action to lower its risk profile resulted in an increase in the BIS ratio from an average of 15% in 2008 to an average of 21% in 2009. KAS BANK’s focus on high-quality assets is reflected in the balance sheet in the growth in the available-for-sale portfolio and the investments at fair value through profit or loss and the simultaneous decrease in loans and advances. The relatively large increase in banks and the decrease in loans and advances are mainly the product of different levels of netting of debit and credit balances which, under the accounting rules, are not netted in the balance sheet but are netted in calculating the weighted assets and the capital requirement.
The Tier 1 capital increased to €145 million. The risk-weighted value of the assets, including off-balance-sheet commitments and operational risk, decreased €233 million to €707 million (2008: €940 million). The year-end carrying amount is compared with the risked-weighted value in the table below.
| (in millions of euros) | Carrying Riskweighted amount 2009 | value 2009 | Carrying amount 2008 | Riskweighted value 2008 |
| Banks | 2,707.4 | 83.2 | 1,693.7 | 145.0 |
| Loans and advances | 907.2 | 45.4 | 2,433.9 | 81.5 |
| Reverse repurchase agreements | 584.3 | 0.6 | 732.6 | 0.0 |
| Derivative financial instruments | 92.1 | 74.7 | 386.1 | 140.7 |
| Investments at fair value through profit or loss | 154.6 | – | 32.4 | – |
| Available-for-sale investments | 1,289.3 | 126.1 | 682.4 | 110.7 |
| Property and equipment | 44.1 | 44.1 | 50.7 | 50.7 |
| Other balance sheet items | 550.7 | 59.9 | 1,348.4 | 131.9 |
| 6,329.7 | 434.0 | 7,360.2 | 660.5 | |
| Contingent liabilities | 30.8 | 5.5 | 84.6 | 7.4 |
| Irrevocable facilities | 62.8 | – | 58.0 | – |
| Operating risk | 252.4 | 230.1 | ||
| Securities lending | 14.9 | 41.7 | ||
| Total of the risk-weighted items | 706.8 | 939.7 | ||
| 2009 | BIS 2009 | 2008 | BIS 2008 | |
| Tier 1 | 145.0 | 21% | 141.3 | 15% |
| Tier 2 | 22.3 | 24.4 | ||
| Total BIS | 167.3 | 24% | 165.6 | 18% |
Liquidity
The following maturity calendars show the non-discounted cash flows from KAS BANK’s financial assets (excluding equities) on the basis of the contractual maturity date:
| Maturity calendar as at year-end 2009 | On demand | ≤ 3 months | ≤ 1 year | ≤ years | >5 years | Total |
| Banks, loans and advances and other financial assets | 76% | 20% | 1% | 1% | 2% | 100% |
| Available-for-sale investments | 20% | 4% | 20% | 46% | 10% | 100% |
| Total financial assets | 63% | 17% | 5% | 11% | 4% | 100% |
| Maturity calendar as at year-end 2008 | On demand | ≤ 3 months | ≤ 1 year | ≤ 5 years | > 5 years | Total |
| Banks, loans and advances and other financial assets | 81% | 18% | 0% | 0% | 1% | 100% |
| Available-for-sale investments | 4% | 16% | 24% | 26% | 30% | 100% |
| Total financial assets | 72% | 18% | 3% | 3% | 4% | 100% |
The financial assets remain highly liquid, with 63% available on demand as at year-end 2009 (year-end 2008: 72%). The increase in financial assets with a maturity of between one and five years from 3% to 11% relates mainly to investments in government-guaranteed bonds, on which the interest-rate risk has been mitigated by swapping for three-month Euribor plus a premium. As at year-end 2009, the liquidity surplus by the Financial Supervision Act’s definition was €1.6 billion (2008: €1.5 billion).
Strategy and objectives
KAS BANK aims to be a leader in wholesale securities services in Europe in the field of transaction processing, custody and risk management. The strategy we have adopted to achieve this objective is based on ‚pure play‘, neutrality, transparency and financial stability.
With our clear focus on wholesale securities services, our relationship with our clients is that of a partner. We have designed a business model that precludes any conflict of interest with clients and our activities represent no threat to our clients in their area of specialisation. This combination of ‚pure play‘, financial solidity and client focus constitutes the critical added value offered by KAS BANK.
The essential components of our strategy, our approach to risk management and our financial targets are considered in greater depth below.
Target groups
KAS BANK has operated on the wholesale market, serving only institutional investors and financial institutions, since 2007. Our clients can be divided into six groups: pension funds (including their clients such as savers and administrative organisations), insurance companies, investment funds, asset managers, banks and brokers. Within these six groups, there are a number of specific categories, such as lower-tier government, charitable institutions and housing associations. We do not provide services for retail clients directly.

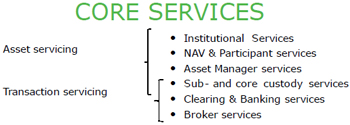
Products and services
KAS BANK offers its clients a wide range of securities-related services and products. The services are divided into transaction servicing (supporting the settlement of securities transactions in the broadest sense) and asset servicing (custody and management of securities, including administration, valuation, monitoring and risk management). KAS BANK is unique in that it specialises exclusively in securities support services and operates exclusively on the instructions of its clients.
KAS BANK has built a strong position in the European clearing and settlement market. By the end of 2009, there were ten alternative stock exchanges connected to our single technical platform, as well as eighteen traditional stock exchanges. This gives our clients access to the entire infrastructure in Europe on one platform. The platform processes both securities and derivatives, facilitates over-the-counter (OTC) transactions (unquoted securities) and monitors the clients‘ risks as well as the bank’s. Its centralised structure makes it easy to expand, in terms of scope (new stock exchanges, Central Counter Parties and the European Central Bank’s Target2Securities system) and product content (including direct market access and back-office administration).
On the institutional market, both the focus and the services are shifting increasingly from legal ownership (custody) to economic ownership (investment administration and risk management). KAS BANK offers a complete package of services in this area, which will continue to grow in complexity and depth in the coming years. Benefiting from the good standing of the Netherlands in the field of pension management and the bank’s own reputation and experience, KAS BANK can steadily extend its position in Germany, the United Kingdom and other European countries.
Regions
KAS BANK operates mainly in Europe. Although the bank’s growth ambitions are concentrated at present mainly on the West European markets, growth in Central Europe is a longer-term objective. Our global network of close to a hundred correspondent banks ensures high-quality services outside Europe.
The primary function of our offices in London, Wiesbaden and Amsterdam is to support institutional investors and financial institutions. Apart from their commercial activities, the offices outside the Netherlands perform only the necessary minimum of administrative and risk-management tasks; central management and processing are handled in Amsterdam. KAS BANK is therefore a centrally organised bank, from the perspective of both the client and the regulator.
Environment
KAS BANK’s analysis of its environment encompasses financial/economic, regulation/supervision, technology, social/cultural and market/client components.
Financial/economic
KAS BANK is at the centre of the financial industry. KAS BANK provides services to financial institutions and institutional investors, is part of the infrastructure and is thus sensitive to developments on the financial markets. This sensitivity affects, on the one hand, the volume component interalia in securities transactions and securities lending and, on the other, in the case of interest-rate-dependent operations, the evolution of the interest-rate curve.
Regulation/supervision
The credit crisis highlighted how interdependent the financial sector has become, both within and across national borders. In some instances, this interdependence triggered undesirable chain reactions, exposing the business models of several banks as incapable of withstanding the pressures of the market as a whole. Thanks to effective action by central banks and various governments, a global systemic crisis was averted. The price that has been paid is the distortion of the level competitive playing field by the various liquidity measures, direct capital support and other factors.
In the wake of the credit crisis, numerous measures have been taken to optimise risk management within the financial sector and improve supervision. This action has prompted financial institutions to reconsider their strategy and review which activities do and do not form part of their core competences. The question that now arises is whether, given their high degree of specialisation and complexity, wholesale securities services can still be counted among the core competences of diversified financial institutions. The first indications are that the credit crisis will initiate a new wave of outsourcing of securities functionalities.
Meanwhile, the more intensive risk management practised by client organisations and external supervisors is creating a growing demand for information and supplementary reporting. In the institutional market, there has been evidence for some time of a trend towards consolidation among pension funds, driven by the need to have a minimum size to meet the increasing demands placed on pension institutions. At the same time, the number of pension administrators, among which insurance companies must also be counted, is growing. These pension administrators take over the duties and obligations of the small funds and integrate them into their own operations. Similar processes are also in evidence in Germany and the United Kingdom.
Technology
High-grade technology is essential to ensure the best possible quality of service in the environment in which KAS BANK operates. Our ICT processes and procedures are continuously updated and optimised to keep pace with the rapid developments in the securities industry. We also invest continuously in high-quality hardware and software and in the expertise and skills of our ICT staff. An important element here is the internal In Control Statement for KAS BANK’s operating ICT processes, as an extension of SAS 70. A SAS 70 Type II report was published in respect of the second half of 2009.
Social/cultural
As part of the financial sector, KAS BANK was also affected in 2009 by the loss of confidence in the banking sector on the part of politicians and public. We are pleased to report that our clients‘ confidence in KAS BANK was unshaken and the bank’s position and operations did not become the subject of wider public debate. On the contrary, a broad sector of the market expressed a growing positive interest in financial institutions that combined clear client focus and a high degree of specialisation, because they were perceived as capable of accurately assessing and subsequently managing their risk profile.
KAS BANK has not had recourse to government support during the credit crisis or thereafter and, given the bank’s financial position, it has not been necessary to call on the shareholders for additional capital. Notwithstanding the comparatively exceptional position that KAS BANK occupies, both within the financial sector and within our international theatre of operations, we do not undervalue the importance of the various measures taken by national governments.
Market/client
The European securities market has historically been a fragmented market. The purpose of the Markets in Financial Instruments Directive (MiFID), which came into effect in Europe in 2007, was to improve the transparency and effectiveness of the European markets. One of the consequences of MiFID has been that the existing European stock exchanges have started to compete with one another and with the new alternative stock exchanges, the Multilateral Trading Facilities (MTFs). The same is about to happen with the clearing institutions. Lastly there is the Target2Securities (T2S) initiative led by the European Central Bank, which aims to further harmonise the settlement and custody of securities in Europe.
A direct consequence of all these initiatives will be that European securities settlement will become increasingly complex. KAS BANK fully supports the ultimate objective – a competitive internal European securities market – and, until that becomes a reality, will continue to offer a European service that is complementary to those initiatives and developments.
To compete more effectively, KAS BANK will further define its positioning as a specialist provider of tailor-made services. More support capacity will be provided for each client relationship, directly responding to the growing demand for intensive operational assistance on the part of KAS BANK’s clients, both financial institutions and institutional clients.
A noteworthy development in this context, prompted to some extent by recent events, is the changing profile of clients‘ preferred type of custody organisation. They increasingly favour specialists and compact organisations whose balance sheets (and hence the counterparty risk they present) can be readily interpreted. As a specialist in settlement services with a strong liquidity position and a low risk profile, KAS BANK is attractive to (larger) players which have made ‚a specialist with a sound reputation, close to home‘ one of their selection criteria. They increasingly perceive KAS BANK as a logical discussion partner.
Due to the influence of the regulators, factors which are becoming increasingly important in the selection of custody and administration services – apart from high-quality service and a competitive price – include the quality of the provider’s monitoring framework, its knowledge of local infrastructures and tax law and the human factor in the advice and support provided for the client. These are areas where specialists like KAS BANK can profile themselves more strongly. Production and support need to be moved back closer to the client. KAS BANK is responding actively to these changing client preferences as a means of raising our competitiveness.
SWOT analysis for KAS BANK
| Strengths | Weaknesses |
| ‚Pure play‘ strategy | Limited geographical scale |
| Strong position in Dutch market | Relatively low growth |
| Strong capital adequacy and liquidity position | Instability of financial markets |
| Opportunities | Threats |
| Outsourcing | Competition from CSDs |
| Growth outside the Netherlands | Sustained pressure on prices |
| Investment funds | Slow recovery in securities lending market |
Trends
With the passage of time, custodians have increasingly assumed the information management function. In an ever more strictly regulated environment such as the securities industry, this function is bound to grow in importance. In broadening the scope of its services, KAS BANK is expressly anticipating the growing effect of regulation. For example, we are responding actively to the trend on the part of financial institutions to require their transactions to pass through central counterparties. We established a direct link to the Scandinavian infrastructure in 2009 when a central clearing mechanism was introduced there. The reserves requirements that have been announced for unquoted derivatives under Basel II will further support and accelerate the move towards central settlement of these and other asset classes, creating more opportunities for us to expand our services in the near future.
Market self-regulation also offers good growth potential for KAS BANK. In response to the changes in the stock exchange landscape wrought by MiFID, we have positioned ourselves more explicitly as post-trade experts in broker solutions, offering direct access to multiple stock exchanges and MTFs. Our services are integrated into the software (KAS BANK-inside) that we provide for trading clients. We foresee ongoing development in this area, with high-frequency traders growing in importance and the traditional wide spreads continuing to narrow. We also expect further fragmentation of trading liquidity in 2010, although the pace of change will be slow.
The increasing complexity of the investment process and the growing need to be ‚in control‘ are reflected in continuing sales of our risk management products, with clients expressing strong interest in our Institutional Risk Management (IRM) monitor and our Peek Through service (which gives access to the underlying values of investment funds). Our proposition is strengthened by our independent position (we do not offer asset management). Implementation and monitoring by KAS BANK are becoming ever more important as a source of independent validation of the effective discharge of management responsibilities.
KAS BANK has already taken over the investment guideline monitoring function required by the regulator on behalf of many pension fund boards and pension departments. This function will continue to grow in importance for pension funds operating under the increasing regulatory pressure. We envisage rising demand for our risk management and reporting services within the institutional investor segment. The shift towards more extensive outsourcing (in response to pressure exerted by regulators) also necessitates further professionalisation of the monitoring framework. KAS BANK will position itself even more explicitly as a specialist in monitoring the investment and risk guidelines of institutional investors, acting on behalf of the board. In this function, we offer audits of the investment process, the results and the quality of prices, giving the board the overview it needs of the operating risks inherent in the investment policy implemented under its responsibility.
Our services are consistent with the recommendations made by the Investment Policy and Risk Management Committee in its January 2010 report entitled ‚Pensioen: Onzekere zekerheid‘ (Pensions: Uncertain security), in which it advises pension fund boards to take a more professional approach to structural improvement in their risk management and to implementation of investment policy.
Other trends that are relevant to KAS BANK include the growing popularity of unquoted investments and exchange-traded funds as active investment instruments. In terms of settlement, both instruments still rely heavily on non-automated processes (involving higher operating risks). The automated services which KAS BANK is developing to serve this need represent an advance in both quality and efficiency for our clients and prospects.
Tactical approach
The way in which KAS BANK serves the market’s needs is discussed below under the headings’pure play‘, operational excellence and acquisitions.
‚Pure play‘
For a specialist like KAS BANK, ‚pure play‘ means:
| • no active asset management | |
| • Focus on wholesale securities services | • no active trading for own account |
| • no conflict of interest with clients | |
| • no internal Chinese walls | |
| • neutral | |
| • Focus on core values | • transparent |
| • low risk, stability | |
| • Client-driven | • more and better integration with clients by focusing on specialism |
Operational excellence
We aim constantly for operational excellence in our day-to-day activities. We adopt a ‚zero tolerance‘ processing policy, recognising the need for effective support for our clients‘ confidential and vulnerable processes that KAS BANK systems provide.
Our striving for operational excellence involves making constant make-or-buy choices. We purchase both IT platforms and specific services and products from third parties. This also enables us to offer clients specialised services of high quality.
Acquisitions
The credit crisis underlines once again the importance of specialisation and good risk management. With new regulations and the greater client emancipation making wholesale securities services within Europe ever more complex, generic financial institutions are increasingly looking to outsource their activities in this area. Such transactions are rather complicated and are often not given the highest priority by the vendor, making it difficult to predict how fast the industry will Ôunravel‘. What is clear is that, as a specialist and’pure player‘, KAS BANK is well placed to meet this demand. Like our first acquisition in Germany in 2008, the acquisition of part of Deutsche Postbank’s investment management business in mid-2009 is an excellent illustration of this.
In both cases, our absolute independence and neutrality were significant additional factors in the vendor’s decision to outsource to KAS BANK. Once again, KAS BANK’s ‚pure play‘ strategy proved its worth, because the absence of any conflict of business interest meant that the relationship with the vendor could last for many more years.
In 2010, given the uncertainties now facing the financial industry, KAS BANK will concentrate on further small acquisitions in Germany in the first instance, then in the Netherlands and the United Kingdom. Acquisitions in other parts of Western and Northern Europe are not, however, being ruled out in advance. The emphasis will be mainly on institutional portfolios.
Any acquisitions will be financed out of the bank’s own funds, on condition that they contribute to earnings per share.
Financial targets
KAS BANK publishes its longer-term financial targets each year. These targets represent averages over a number of years. It may happen, therefore, that the targets are not achieved in any one year, for example due to unrest on the financial markets or an acquisition.
| Ratio | Target | 2009 * | 2008 * |
| Growth in operating income versus growth in operating expenses * | >-3% | 2.4% | -6.3% |
| Efficiency ratio | 70-77% | 79% | 81% |
| Return on equity | 5-8 points above 10-year interest rate | 12% ** | 9% |
| Growth in earnings per share | >8% | 13% | -20% |
| Dividend pay-out ratio | 60-80% | 61% *** | 35% |
| Average BIS ratio | Basel II>-12.5% | 21% | 15% |
* Excluding exceptional items
** 10-year interest rate 2009: 3.7% (2008: 4.2%)
*** Based on operating profit less the amount of the investment in intangible assets relating to the recent acquisition
The financial targets confirm KAS BANK’s low risk appetite. A relatively high BIS ratio, a realistic dividend for the shareholders and a growth target that is related to the trend in expenses mean that KAS BANK is able to prevent undesirable incentives distorting the relationship between growth, risk and return.
Risk control and monitoring systems
That KAS BANK has a low risk appetite was clearly reaffirmed by the Managing Board and endorsed by the Supervisory Board in 2009. The management framework for monitoring and enforcing the low risk profile comprises three elements:
| • |
Prudent management of the mix of wholesale activities. Current and new activities are checked to ensure that they have a low intrinsic risk profile. The bank’s key performance indicators (KPIs) and remuneration policy are consistent with its low risk profile and are monitored to ensure that this is maintained. The bank’s reputation and compliance with its low risk profile are monitored by the Managing Board and the compliance function. |
| • |
Systematic risk management. The bank’s low risk appetite is translated into all identified risk categories. Firm targets are set and enforced within the applicable management frameworks. These include operating a ‚zero tolerance‘ policy on operating risks, lending only against adequate collateral of high quality and maintaining ample liquidity and capital reserves. |
| • |
Capital management. Even a low risk profile involves some risk, albeit limited, because risk is inherent in business. The risks are absorbed by the bank’s resilience, in which its profit capacity and capital buffers are significant elements. Internal capital requirements are set for the bank’s activities, in addition to those imposed by the regulator. Capital planning is part of the annual budget-setting process. |
The risk management framework comprises three lines of defence:
| • |
the first is line management, which is responsible for identifying and controlling the risks in its processes and products; |
| • |
the second is formed by the Risk Management, Human Resources, Administrative & Corporate Development, Financial Control & Reporting, Compliance and Legal departments, which are responsible at bank level for analysis, policy preparation and coordination of the management of the risks to which the bank is exposed; |
| • |
the third is the Internal Audit department, which performs an independent checking and auditing function. |
Policy on the various types of risk is determined by the bank’s Asset & Liability Committee and Risk Management Committee. At the Supervisory Board level, the Audit Committee and Risk Management Supervision Committee oversee the Managing Board’s monitoring of compliance with KAS BANK’s risk management policy and procedures.
A number of significant risks can be identified which are inherent in the bank’s strategy, profile and operations:
| • |
Given KAS BANK’s strategic focus, it is dependent on the financial sector. The credit crisis has not only affected the regular services: it may also influence liquidity, counterparty risk and investment of assets. |
| • |
Although KAS BANK is diversifying its sources of income, its revenues are sensitive to transaction volumes in our clients‘ securities trading activities and to stock market prices. Declining market activity and lower prices mean lower income. |
| • |
It was possible in previous years to make expenses variable to some extent by using external specialists and forming partnerships, but the need for adequate numbers of specialist staff and the ongoing investments in IT mean that fixed costs are relatively high. |
| • |
KAS BANK is in competition with major international banks, which in some cases can place it at a disadvantage in terms of economies of scale and name recognition. |
| • |
Despite the loyal client base in the bank’s home market, the reforms in the European capital markets and the growing competition are putting pressure on margins. |
| • |
Reforms being undertaken by and consolidation among our clients, including pension funds, brokers and institutional investors, may have repercussions for KAS BANK. |
| • |
We rely for the correct settlement of our clients‘ transactions and for the quality of our services in general on the proper functioning of our automated systems and of communication with the infrastructure in the context of our European platform. Because there is a large degree of interdependence between our systems and processes, our ability to respond swiftly to external developments is critical. |
| • |
Given the bank’s specialist character, its expertise and the organisation and embodiment of that expertise in procedures, operating instructions and systems are vitally important. |
| • |
For the settlement of client’s securities transactions and payments, the bank holds collateral with (central) banks and clearing and settlement systems, which requires that our balance sheet is sufficiently liquid. The turbulence on the financial markets in recent years and the almost complete drying up of liquidity on the interbank market have made liquidity contingency planning a high priority. |
| • |
Because most of the bank’s credit risk is hedged by collateral, high-quality and diversified collateral management is of primary importance, especially in times of great volatility. |
| • |
The bank is sensitive to developments in the external infrastructure and regulations and the (political) environment in the areas in which KAS BANK operates. State support for banks can distort competitive relationships and create an unlevel playing field. |
| • |
Securities lending income depends on the willingness of pension funds in particular to lend their securities. |
| • |
KAS BANK’s own position in securities is sensitive to price movements due to changing market, interest rate and credit conditions. |
| • |
• The interest result is sensitive to changes in the shape and level of the interest-rate curve. |
Given the dynamics of the relationship between the bank’s services and the environment in which it operates, the internal risk control and monitoring systems are the subject of continuous development. Qualitative and quantitative information on KAS BANK’s exposure to credit risk, market risk, liquidity risk, operating risk and compliance risk can be found in the ‚Risk management‘ section, which also discusses the purposes of and the principles and procedures used in measuring and controlling these risks.
Financial reporting risks
KAS BANK reports in accordance with International Financial Reporting Standards (IFRS), as adopted within the European Union. Continuous improvement of financial and risk-management information is kept under constant review by the bank.
The structure and functioning of the internal risk control and monitoring systems are regularly evaluated in the light of the bank’s objectives and risk profile, assessed by internal and external supervisors and discussed with the relevant committees formed by the Supervisory Board.
In the light of the foregoing, it can be confirmed with reasonable confidence that the internal risk control and monitoring systems relating to reporting have functioned satisfactorily and that the financial reporting therefore contains no material misstatements. It should be understood that, given their inherent limitations, the internal risk control and monitoring systems cannot:
| • |
provide complete assurance concerning the achievement of strategy, objectives or chosen risk profile; |
| • |
prevent all material inaccuracies or instances of loss, fraud or non-compliance with legislation or regulations. |
Developments
By continuously developing and maintaining its internal risk control and monitoring systems, KAS BANK ensures that its services are responsive to the dynamics of the environment in which it operates. Specific areas of attention include operating risk management, intraday risk management and contract management. The bank also invests considerable effort in the quantification of risks, the risk appetite monitoring and management framework, the further integration of capital management into its operations and the risk-return ratio for its activities.
KAS BANK keeps abreast of developments in the field of auditing and compliance and contributes to meetings with regulators, the Netherlands Bankers‘ Association and accounting organisations. At the international level, KAS BANK’s processes comply with the recommendations of the Basel Committee on Banking Supervision and the Financial Action Task Force.
KAS BANK appointed a Chief Risk Officer (CRO) with effect from 1 September. The CRO reports directly to the chairman of the Managing Board and may, on his own initiative, submit matters for discussion by the Managing Board. The CRO may also communicate with the Supervisory Board directly.
2009 in retrospect
Organisational structure
KAS BANK constantly seeks ways of making its organisational structure more efficient, concentrating on improving effectiveness, increasing client focus and raising its efficiency ratio. The organisational structure is configured to provide optimum support for the achievement of KAS BANK’s strategic and commercial objectives. Further enhancing the quality of our services and the effectiveness of our operations is accorded high priority. To clarify our commercial offering, six main service groups have been defined: Institutional Services, Net Asset Value & Participant Services, Asset Manager Services, Sub- & Global Custody Services, Clearing & Banking Services and Broker Services. The Institutional Services group, for example, provides services for pension funds and insurance companies and the Clearing & Banking Services clientele comprises brokers and banks.
Several studies (positioning of network management, organisation of project managers and restructuring of the operating and commercial divisions) and projects were initiated in 2009, addressing such issues as the closure or repartitioning of divisions as a route to making the total organisation more cost-efficient. All the bank’s activities relating to treasury and institutional risk management have been brought together in a new central Treasury function under one manager. A special change management team has been formed to support the reorganisation exercise. The Employee Council’s advice on the plans has been sought at an early stage in all cases.
Client satisfaction
The average score achieved by our services in our annual client-satisfaction survey among the clientele of the Relationship Management Europe division was higher than in 2008. The findings serve as input for the further improvement of our services, working with our clients. In 2009, for example, dedicated client support teams were formed to shorten the lines of communication with the client and make them faster. These teams have specialised Client Support Officers, who are responsible for the functioning of and communication on our clients‘ day-to-day operating processes that are handled by KAS BANK.
As part of the Client Value First project, we shall be conducting periodic client reviews from 2010 onwards, to provide our clients with continuous feedback on KAS BANK’s services. On the basis of those reviews, we shall investigate, with the client, how we can make our services even better.
KAS BANK was named Custodian of the Year at the UK Pension Awards 2009 in London, an initiative of the leading journal Professional Pensions.
SAS 70 Type II
KAS BANK’s SAS 70 reporting has been augmented with a statement on the clearing services. SAS 70-II is a statement on auditing standards that is used worldwide to give assurance that processes are correctly managed. A type II statement covers the design, existence and operating effectiveness of the processes to which it relates. This is tested by both the internal and external auditors. It is KAS BANK policy to extend the scope of the SAS 70 statement year on year, where relevant.
Client value
The focus on client value was further sharpened last year, directed mainly towards client retention and deepening our product range among existing clients. There was again a net increase in the client base in 2009.
The outsourcing of investment administration by institutional investors based on the Application Service Provider (ASP) model has been fully integrated into KAS BANK’s Institutional Management Services (IMS). Via remote access to KAS BANK’s systems, clients can run their portfolio and cash management and generate analyses and reports independently without having to invest the associated ICT effort. This form of modular insourcing is unique in the Dutch institutional sector.
We launched a new information platform in 2009 which gives our clients online access to all the information they need on the Institutional Management Services (IMS) provided by KAS BANK. The IMS Dashboard gives both compressed and detailed management information on the latest position in investments, performance results, risk analyses and more. The integrated report generator enables the client to distil the information in the form required.
The Financial Assessment Framework (abbreviated in Dutch to FTK) for pension funds is being further refined by the Nederlandsche Bank (DNB). This includes the capital adequacy test and continuity analysis for pension funds, to which various simulations based on stress scenarios (post-shock value) have been and will in future be added. KAS BANK provides a full range of services to help pension funds comply with the FTK requirements. On the basis of our analysis of the information provided by the pension fund, its asset managers and the underlying investments, we produce finished FTK reports ready for submission to DNB.
New reporting requirements for investment funds (DRA reporting) came into force in 2009. KAS BANK compiles these reports for a large and growing group of investment funds. On the basis of the international Global Investment Performance Standards (GIPS), we track day-to-day movements in order to monitor the performance of investment portfolios.
In regard to Global Fund Services (GFS), our integrated services in the field of electronic subscription to and desubscription from investment funds, we have joined forces with an investment fund specialist. As a service provider, we offer over 15,000 funds with more than 300 asset management houses via our own fund platform. KAS BANK is the largest fund agent for house funds of institutional investors in the Netherlands. We extended this service again in 2009 with the addition of several major clients.
Another new facility is Broker Services. We take over all the administrative tasks normally performed by the broker – generating settlement instructions for the custodian, counterparty management, fund management, reconciliation, transaction monitoring, financial administration and reporting – allowing the broker to focus 100% on its core business.
Our services to charitable institutions and lower-tier government have been augmented with the addition of support for the boards of charitable institutions in the form of our Institutional Risk Management service.
We prepare and submit the reports to the regulator, as confirmation that the institution complies with the requirements of good and transparent governance.
One of Treasury’s significant new services is the Third-Party Credit Support Annex (CSA) for managing counterparty risk on unquoted derivatives.
To ensure that we continue to provide the required standards of speed, reliability and security, the SWIFT payments infrastructure has been replaced with a new system. Our KAS-Web application was given an all new and more user-friendly interface, which has been received very well by our clients.
Operations
Consistent with our strategic decision to include new European Multilateral Trading Facilities (MTFs) and Central Counter Parties (CCPs) in our centralised uniform clearing and settlement services, many more trading platforms were linked to our European single clearing and settlement platform in 2009. When a CCP mechanism was introduced in Denmark, Finland and Sweden in October 2009, we joined immediately as General Clearing Participant for the regulated stock exchanges of NASDAQ/OMX and MTF Burgundy. In addition to these stock exchanges, we have been providing services in Scandinavian securities for some time via the MTFs Turquoise and Chi-X.
At the end of 2009, we were supporting our clients‘ activities on a total of 28 regulated stock exchanges and MTFs. Their trades are settled by KAS BANK via ten direct connections to CCPs and several Central Securities Depositories (CSDs).
KAS BANK successfully implemented the ESES (Euroclear Settlement of Euronext-zone Securities) project in February 2009. The process took almost three years, making it one of the largest and most complex projects undertaken in the recent past. ESES is an initiative by three CSDs (Euroclear Netherlands, Euroclear Belgium and Euroclear France) to provide an integrated settlement solution for stock exchange and OTC (over-thecounter) transactions on the Euronext stock exchanges in Amsterdam, Brussels and Paris. The project, part of the European Union’s ‚Lisbon agenda‘, is designed to create a better and more competitive capital market in Europe. The implementation of ESES has involved numerous technical modifications to KAS BANK’s system. We took the opportunity to simplify many processes for KAS BANK’s clients and update the information services.
A significant event in payments was the entry into effect of the European Payment Services Directive on 1 November 2009. The directive imposes rules for all payments in the currencies of the countries of the European Economic Area (EEA) to make them as easy, efficient and secure as inland payments. Further progress was also made towards the introduction of uniform SEPA (Single European Payment Area) transfers, which will further harmonise European payments. Work on this project is proceeding with undiminished vigour in 2010.
Developments in ICT
KAS BANK’s mainframe and mainframe management were outsourced 100% to an external service provider in Germany in 2009. Our objective in outsourcing the mainframe – better mainframe performance and adequate capacity on demand – has been more than realised. KAS BANK’s physical servers have also been reduced in number as we make further progress towards virtualisation of the server fleet. This has also markedly reduced ICT’s carbon footprint.
KAS BANK was awarded a TÜViT certificate in 2009 for its Tri-Party Collateral Management (TPCM) application. TÜViT certification is clear evidence of an application’s technical quality and ability to adapt to future change (flexibility) and confirms that the application reduces management costs and manages risks more effectively.
Germany
KAS BANK has had a branch office in Germany since early 2008 and its own subsidiary there, KAS Investment Servicing GmbH (KAS IS), since July 2008. KAS IS is a ‚Master-KAG‘ (Kapitalanlagegesellschaft), a Germanregulated entity for the issue and administration of investment funds, and provides only fund administration and related services for German institutional investors.
On 1 August 2009, we again expanded our asset servicing activities with the acquisition of a second KAG: Deutsche Postbank Privat Investment Kapitalanlagegesellschaft mbH (PPI). Rapid operating integration with KAS BANK’s technical systems has strengthened our position in the German market as a neutral, specialised provider of administrative services for securities and investment. The legal merger of the two KAGs into a single German KAG for KAS BANK was completed shortly after the acquisition.
Preparations have started at KAS BANK German Branch for the introduction of ‚Depotbank‘ (custodian bank) services under German law. As a’Depotbank‘, KAS BANK will act as trustee and global custodian for German investment funds and institutional investors such as insurance companies and pension funds.
United Kingdom
In difficult and challenging economic conditions, KAS BANK UK Branch maintained its position as an independent specialist in the UK market, with growth in the client base among both institutional investors and financial institutions. Our independence, low risk profile and successful track record are evidently important considerations for pension funds, asset managers, banks and brokers and their consultants.
Our comprehensive and flexible clearing, settlement and back-office services were key factors in the ‚insourcing‘ of several banks and brokers in 2009. Strategic partnerships with a number of leading players in the securities industry made a substantial contribution to the growth in our clearing and settlement services for algo traders and third-party brokers on both the regulated European stock exchanges and MTFs.
With risk awareness high on the agenda, there is increasing interest in KAS BANK’s Institutional Risk Management services, particularly among pension funds.
Outlook and operating targets for 2010
With interoperability between the various CCPs currently under discussion in Europe, the end of the one-to-one relationship between trading platform and CCP is in sight. The deciding factors in our choice of one or more CCPs will include pricing, risk monitoring and operating efficiency.
Another important debate concerns the need for a CCP for unquoted derivatives. It is very likely that five CCPs will compete for the trade in unquoted derivatives. In the interests of a stable, shockproof system, KAS BANK argues that they should in no case compete on risk and there must be clear agreement on margin policy.
To support the growing demand for settlement of transactions on the alternative stock exchanges in Europe (MTFs), KAS BANK intends to further increase the number of direct connections to the European infrastructure in 2010. For example, we expect to become a General Clearing Member of Oslo Clearing ASA, the CCP for Oslo Börs, the Norwegian stock exchange, and plan to connect to the Swedish and Finnish CSDs, Euroclear Sweden and Euroclear Finland.
We are also responding actively to the ongoing trend among institutional investors to outsource their administrative processes. In the context of pension fund governance, they are required to be demonstrably ‚in control‘, and for this they use KAS BANK’s risk management services and products.
We are developing an integrated outsourcing service, including order execution, for brokers and financial institutions. The existing services in the field of custody, clearing and settlement, outsourcing of back-office activities and order execution will be offered as one package.
In Germany, we are continuing to expand our offering with the introduction of ‚Depotbank‘ services and expect to be granted final approval by BaFin, the German regulator, this year. We shall then be the only independent provider of (global) custody,’Depotbank‘ and fund administration (‚KAG‘) services within one group in the German market.
Direct interaction with all the major financial institutions in Europe will remain an important facet of our presence in the United Kingdom. We also foresee further growth in our institutional business through continuing cooperation with the consultants that are active in this market. With our ‚pure play‘ strategy, we can position ourselves strongly as a good partner offering supplementary (non-competing) services for the many small and medium-sized pension funds.
ICT
KAS BANK made a strategic choice some years ago to migrate its Adabas/Natural-based mainframe systems to a new environment based on the Microsoft dot.NET architecture. The FundIT migration programme laid the foundations for the new ICT infrastructure and a new environment for the development of applications based on this technology. This programme will continue for the next two years, taking a phased approach, and the current software will gradually be replaced by (new) packages or new build or via automated conversion. On a regular basis, the migration programme is subjected to internal and external audits and evaluations, the migration steps are subjected to risk assessments and risk-mitigating measures are implemented. The securities lending functionality has already been replaced by an external application, the SWIFT architecture has been successfully migrated and the KAS BANK portal (KAS-Web) has been converted to dot.NET architecture.
Human resources
KAS BANK’s corporate culture based on individual responsibility fosters positive and active involvement by the staff. Investing in staff development is also part of KAS BANK’s corporate culture. The training budget last year was around 3% of the payroII. KAS BANK invests part of the budget in in-house training courses given by our own specialists, which helps to promote the dissemination of knowledge within the organisation.
A Mobility Centre ensures that vacancies are filled internally as far as possible. The centre also actively helps staff find other work.
The introduction of Individual Performance Management was completed in 2009. All staff are now employed under an individual performance contract (IPC) and are assessed on the basis of the IPC. The individual performance assessment results are linked to a system of variable remuneration under which, in addition to the opportunities provided by the collective labour agreement, the award of stock options is also related to the performance achieved.
Corporate social responsibility
KAS BANK is the first’pure play‘ custodian in the world to sign up to the Principles for Responsible Investment (PRI), an initiative of the United Nations. These principles help investors incorporate ESG (environmental, social and governance) factors into their investment decisions. As a professional service provider working in the securities industry, we use our network and our influence to emphasise the importance of the Principles. We also help our clients to translate the Principles into practical and realistic policy, for example with our Sustainability Risk Screening service. This service involves checking that asset managers are not investing in companies that have been placed on the institutional investor’s watch list and reporting our findings to the client. This provides the client with a reliable monitoring and warning function as part of its sustainable investment strategy.
Corporate governance statement
This is a statement pursuant to Section 2a of the Decree on additional requirements for annual reports (Vaststellingsbesluit nadere voorschriften inhoud jaarverslag) of 1 April 2009 (the ‚Decree‘).
The information required to be included in this corporate governance statement as described in Sections 3, 3a and 3b of the Decree can be found in the following sections and pages of this annual report and are deemed to be included and repeated in this statement:
| • |
information concerning compliance with the principles and best-practice provisions of the Dutch corporate governance code can be found in the ‚Corporate governance‘ section and on KAS BANK’s website www.kasbank.com/investorrelations/corporategovernance; |
| • |
information concerning compliance with the principles of the Dutch Banking Code can be found in the ‚Corporate governance‘ section and on KAS BANK’s website www.kasbank.com/investorrelations/corporategovernance; |
| • |
the corporate governance code was published in the Bulletin of Acts, Orders and Decrees (Staatscourant) of 3 December 2009, no. 18499, and can be found online at www.commissiecorporategovernance.nl; |
| • |
the Banking Code is posted on the Dutch Banking Association’s website: www.nvb.nl; |
| • |
information on the principal features of the control and monitoring system in relation to KAS BANK’s financial reporting process can be found in the Report of the Managing Board (in ‚Risk control and monitoring systems‘) and notes 42-49 of the financial statements (‚Notes on risk management‘) |
| • |
information on the functions and principal powers of the shareholders‘ meeting and the rights of the shareholders and how they may be exercised can be found in ‚Corporate governance‘ section under ‚General Meeting of Shareholders‘; |
| • |
information on the composition and functioning of the Managing Board can be found in the ‚Corporate officers‘ section and the ‚Corporate governance‘ section under ‚Managing Board‘; |
| • |
information on the composition and functioning of the Supervisory Board and its committees can be found in the ‚Corporate officers‘ section, the’Report of the Supervisory Board‘ and the ‚Corporate governance‘ section under ‚Supervisory Board‘; |
| • |
information on shareholdings in the company that are subject to mandatory notification under the Financial Supervision Act (Wet op het financieel toezicht) can be found in the’Information for shareholders‘ section |
| • |
information on the regulations for the appointment and replacement of members of the Managing Board and Supervisory Board can be found in the ‚Corporate governance‘ section under ‚Managing Board‘ and ‚Supervisory Board‘, respectively; |
| • |
information on the regulations for amendment of the company’s Articles of Association can be found in the ‚Corporate governance‘ section under ‚Amendment of the Articles of Association‘. |
| • |
information on the powers of the members of the Managing Board and Supervisory Board in respect of the issue and repurchase of shares can be found in the ‚Corporate governance‘ section under ‚Managing Board‘. |
The main outlines of the company’s corporate governance structure and recent developments in the field of corporate governance are discussed in the ‚Corporate governance‘ section.
Statement pursuant to Section 5, subsection 25.c, of the Financial Supervision Act
The Managing Board affirms that the annual report provides a true and fair view of the company’s position on the balance sheet date and the course of affairs during the financial year of the company and the related enterprises whose figures are included in its financial statements and that the annual report describes the principal risks to which the company is exposed.
Amsterdam, 3 March 2010
Managing Board
A.A Röell, chairman
R.J. Kooijman, CFO
N.E. Blom
S.A.J. van Katwijk
FINANCIAL STATEMENTS 2009
Consolidated income statement
| (in thousands of euros) | Total 2009 | Exceptional result 2009 | Result from normal operations 2009 | Total 2008 | Exceptional result 2008 | Result from normal operations 2008 | |
| Income | |||||||
| Interest income | 1 | 86,886 | – | 86,886 | 311,160 | – | 311,160 |
| Interest expense | 2 | 56,301 | 56,301 | 282,283 | 282,283 | ||
| Net interest | 30,585 | – | 30,585 | 28,877 | – | 28,877 | |
| Commission income | 3 | 90,289 | – | 90,289 | 106,009 | -106,009 | |
| Commission expense | 4 | 14,960 | – | 14,960 | 16,796 | – | 16,796 |
| Net commission | 75,329 | – | 75,329 | 89,213 | – | 89,213 | |
| Investments at fair value | |||||||
| through profit or loss: | 5 | 12,780 | -1,396 | 14,176 | 9,071 | -2,684 | 11,755 |
| Available-for-sale investments | 5 | 16,133 | 6,270 | 9,863 | 1,815 | 1,815 | |
| Result on investments | 28,913 | 4,874 | 24,039 | 10,886 | -2,684 | 13,570 | |
| Other income | 6 | 2,015 | 2,015 | 652 | – | 652 | |
| Total income | 136,842 | 4,874 | 131,968 | 129,628 | -2,684 | 132,312 | |
| Operating expenses | |||||||
| Staff costs | 7 | 67,292 | – | 67,292 | 70,141 | – | 70,141 |
| Other administrative expenses | 8 | 29,849 | 805 | 29,044 | 30,133 | 906 | 29,227 |
| Depreciation/amortisation | 9 | 8,121 | – | 8,121 | 7,902 | – | 7,902 |
| Operating expenses | 105,262 | 805 | 104,457 | 108,176 | 906 | 107,270 | |
| Impairment losses | 10 | -261 | -261 | – | 73,423 | 73,423 | – |
| Total operating expenses | 105,001 | 544 | 104,457 | 181,599 | 74,329 | 107,270 | |
| Result for the period before | |||||||
| tax | 31,841 | 4,330 | 27,511 | -51,971 | -77,013 | 25,042 | |
| Tax expenses | 11 | 7,350 | 713 | 6,637 | -11,950 | -18,290 | 6,340 |
| Result for the period | 24,491 | 3,617 | 20,874 | -40,021 | -58,723 | 18,702 | |
| Attributable to: | |||||||
| Equity holders of the bank | 24,581 | 3,617 | 20,964 | -39,933 | -58,723 | 18,790 | |
| Minority interests | -90 | – | -90 | -88 | – | -88 | |
| Earnings per share | 12 | ||||||
| – basic (in euros) | 1.69 | -2.70 | |||||
| – diluted (in euros) | 1.67 | -2.69 |
Consolidated statement of comprehensive income
| (in thousands of euros) | 2009 | 2008 | |||||
| Before tax | Tax | After tax | Before tax | Tax | After tax | ||
| Result for the period | 24,491 | -40,021 | |||||
| Revaluation of land and buildings in use by the company | 36 | -4,218 | 1,076 | -3,142 | – | – | – |
| Gains and losses on available-for-sale investments | 36 | 23,826 | -6,474 | 17,352 | -31,168 | 8,724 | -22,444 |
| Gains and losses on available-for-sale investments recognised in the income statement | 36 | -8,191 | 2,089 | -6,102 | -932 | 238 | -694 |
| Impairment losses | |||||||
| Available-for-sale investments | 36 | 93 | -24 | 69 | 32,890 | -8,387 | 24,503 |
| Actuarial gains and losses on pensions | 37 | -3,872 | 987 | -2,885 | 317 | -81 | 236 |
| Income and expense recognised directly in equity | 7,638 | -2,346 | 5,292 | 1,107 | 494 | 1,601 | |
| Total comprehensive income for the period | 29,783 | -38,420 | |||||
| Attributable to: | |||||||
| Equity holders of the bank | 29,873 | -38,332 | |||||
| Minority interests | -90 | -88 | |||||
| Total comprehensive income for the period | 29,783 | -38,420 | |||||
Consolidated balance sheet
Assets
| (in thousands of euros) | 31-12-2009 | 31-12-2008 | |
| Cash and deposits at the central bank | 13 | 469,340 | 1,248,801 |
| Banks | 14 | 2,707,426 | 1,693,720 |
| Loans and advances | 15 | 907,182 | 2,433,933 |
| Reverse repurchase agreements | 16 | 584,346 | 732,641 |
| Derivative financial instruments | 17 | 92,141 | 386,095 |
| Investments at fair value through profit or loss | 18 | ||
| – Investments held for trading | – | 5,583 | |
| – Investments classified as assets measured at fair value through profit or loss | 154,630 | 26,893 | |
| Available-for-sale investments | 19 | 1,289,270 | 682,440 |
| Current tax assets | 21 | 25,447 | 35,570 |
| Other assets | 22 | 13,638 | 24,119 |
| Prepayments and accrued income | 23 | 17,361 | 19,662 |
| Property and equipment | 24 | 44,062 | 50,690 |
| Intangible assets | 25 | 21,002 | 17,194 |
| Deferred tax assets | 26 | 3,840 | 2,897 |
| Total assets | 6,329,685 | 7,360,238 | |
|
Equity and liabilities |
|||
| Banks | 27 | 2,328,351 | 1,217,131 |
| Funds entrusted | 28 | 3,649,066 | 5,524,028 |
| Derivative financial instruments | 17 | 116,144 | 395,689 |
| Current tax liabilities | 21 | 1,354 | 1,297 |
| Other liabilities | 29 | 1,235 | 12,216 |
| Accruals and deferred income | 30 | 22,686 | 28,632 |
| Provisions | 31 | 740 | 906 |
| Deferred tax liabilities | 26 | 13,097 | 9,856 |
| Employee benefits | 32 | 3,814 | 3,055 |
| Total liabilities | 6,136,487 | 7,192,810 | |
| Share capital | 33 | 15,699 | 15,699 |
| Treasury shares | 34 | -25,417 | -25,417 |
| Share premium | 35 | 21,569 | 21,569 |
| Revaluation reserve | 36 | 27,688 | 19,937 |
| Other reserves | 37 | 134,057 | 175,653 |
| Unappropriated result | 38 | 19,772 | -39,933 |
| Total equity attributable to the equity holders of the bank | 193,368 | 167,508 | |
| Minority interests | -170 | -80 | |
| Total equity | 193,198 | 167,428 | |
| Total equity and liabilities | 6,329,685 | 7,360,238 | |
| Contingent liabilities | 39 | 30,844 | 84,615 |
| Irrevocable facilities | 40 | 62,816 | 58,021 |
Consolidated statement of changes in equity
| (in thousands ofeuros) | Share capital | Treasury shares | Share premium | Revaluation reserve | Other reserves | Unappropriated result | Total attributable to equity holders | Minority interests | Total equity |
| Balance as at 1 January 2008 | 15,699 | -14,675 | 21,569 | 18,890 | 169,582 | 43,872 | 254,937 | 254,937 | |
| Comprehensive income for the period | |||||||||
| Result for the period | -39,933 | -39,933 | -88 | -40,021 | |||||
| Realised gains and losses recognised directly in equity | -318 | 318 | – | – | |||||
| Income and expense recognised directly in equity 1 | 1,365 | 236 | 1,601 | 1,601 | |||||
| Total | 1,047 | 554 | -39,933 | -38,332 | -88 | -38,420 | |||
| Transactions with shareholders recognised directly in equity | |||||||||
| Profit appropriation for previous year | 10,118 | -10,118 | – | – | |||||
| Dividend 2007 | -33,754 | -33,754 | -33,754 | ||||||
| Purchase of treasury shares | -12,081 | -12,048 | -12,048 | ||||||
| Sale of treasury shares | 1,339 | 1,862 | 3,168 | 3,168 | |||||
| Share-based payments | 647 | 647 | 647 | ||||||
| Interim dividend 2008 | -7,065 | -7,065 | -7,065 | ||||||
| Other movements | -45 | -45 | -45 | ||||||
| Acquisition of minority interests | 8 | 8 | |||||||
| Total | -10,742 | 5,517 | -43,872 | -49,097 | 8 | -49,089 | |||
| Balance as at 31 December 2008 | 15,699 | -25,417 | 21,569 | 19,937 | 175,653 | -39,933 | 167,508 | -80 | 167,428 |
| Balance as at 1 January 2009 | 15,699 | -25,417 | 21,569 | 19,937 | 175,653 | -39,933 | 167,508 | -80 | 167,428 |
| Comprehensive income for the period | |||||||||
| Result for the period | 24,581 | 24,581 | -90 | 24,491 | |||||
| Realised gains and losses recognised directly in equity | -426 | 426 | |||||||
| Income and expense recognised directly in equity 1 | 8,177 | -2,885 | 5,292 | 5,292 | |||||
| Total | 7,751 | -2,459 | 24,581 | 29,873 | -90 | 29,783 | |||
| Transactions with shareholders recognised directly in equity | |||||||||
| Profit appropriation for previous year | -39,933 | 39,933 | – | – | |||||
| Purchase of treasury shares Sale of treasury shares | |||||||||
| Share-based payments | 796 | 796 | 796 | ||||||
| Interim dividend 2009 | -4,809 | -4,809 | -4,809 | ||||||
| Other movements | |||||||||
| Acquisition of minority | |||||||||
| interests | |||||||||
| Total | – | -39,137 | 35,124 | -4,013 | – | -4,013 | |||
| Balance as at 31 December 2009 | 15,699 | -25,417 | 21,569 | 27,688 | 134,057 | 19,772 | 193,368 | -170 | 193,198 |
1 For details, reference is made to the consolidated statement of comprehensive income.
Consolidated statement of cash flows
| (in thousands of euros) | 2009 | 2008 | |
| Cash flow from operating activities | |||
| Result for the period attributable to equity holders of the bank | 12 | 24,581 | -39,933 |
| Adjustments for: | |||
| Depreciation/amortisation | 9 | 8,121 | 7,902 |
| Impairment losses | 10 | -261 | 73,423 |
| Interest recognised in the income statement | 1/2 | -30,585 | -28,877 |
| Dividends recognised in the income statement | 5 | -1,861 | -908 |
| Tax expense on the result recognised in the income statement | 11 | 7,350 | -11,950 |
| Changes in: | |||
| Banks (not on demand) | 14/27 | 1,042,491 | -706,948 |
| Loans and advances | 15 | 1,526,639 | -100,357 |
| Reverse repurchase agreements | 16 | 148,295 | 669,967 |
| Derivative financial instruments | 17 | 14,409 | 26,541 |
| Investments at fair value through profit or loss | |||
| – Purchase of investments held for trading | 18 | – | -8,852 |
| – Sale of investments held for trading | 18 | 5,617 | 3,269 |
| Funds entrusted | 28 | -1,874,962 | -338,912 |
| Other movements in respect of operating activities | -621 | -18,181 | |
| Payments and receipts in respect of: | |||
| Tax expense | 21 | 3,418 | -9,286 |
| Employer’s contribution to retirement benefits | 32 | -5,830 | -7,786 |
| Interest income | 87,458 | 311,704 | |
| Dividends | 5 | 1,861 | 908 |
| Interest expense | -57,076 | -286,391 | |
| Total cash flow from operating activities | 899,044 | -464,667 | |
| Cash flow from investing activities | |||
| Investments and acquisitions | |||
| Investments classified as assets measured at fair value through profit or | |||
| loss | 18 | -125,410 | -25,652 |
| Available-for-sale investments | |||
| – Money market paper | 19 | -408,650 | -1,103,066 |
| – Bonds | 19 | -820,152 | -360,943 |
| – Shares | 19 | -6,610 | -10,431 |
| Property and equipment | 24 | -1,204 | -2,685 |
| Acquisition of subsidiaries | 20 | -15,032 | -18,064 |
| Intangible assets (excluding goodwill) and other assets | 25 | -3,558 | -5,820 |
| -1,380,616 | -1,526,661 | ||
| Disposals, repayments and sales | |||
| Available-for-sale investments | |||
| – Money market paper | 19 | 266,653 | 1,427,339 |
| – Bonds | 19 | 383,754 | 680,671 |
| – Shares | 19 | 12,790 | 506 |
| 663,197 | 2,108,516 | ||
| Total cash flow from investing activities | -717,419 | 581,855 | |
| Cash flow from financing activities | |||
| Repurchase of own shares | 35/37 | – | -8,880 |
| Redemption of subordinated liabilities | – | -11,344 | |
| Dividend paid | 37/38 | -4,809 | -40,817 |
| Total cash flow from financing activities | -4,809 | -61,041 | |
| Net cash flow | 176,816 | 56,147 | |
| Cash and cash equivalents at the beginning of the year | 2,611,428 | 2,555,281 | |
| Net cash flow | 176,816 | 56,147 | |
| Cash and cash equivalents at the end of the year | 2,788,244 | 2,611,428 | |
| Reconciliation of cash flow statement with balance sheet items | |||
| Cash and deposits at the central bank | 13 | 469,340 | 1,248,801 |
| Due on demand from other credit institutions | 14 | 2,318,904 | 1,362,627 |
| Cash and cash equivalents at the end of the year | 2,788,244 | 2,611,428 |
Accounting policies
General
KAS BANK N.V. has its registered office in Amsterdam, Netherlands. The company’s consolidated financial statements for the year ending 31 December 2009 include the parent company and all its subsidiaries, together referred to as ‚KAS BANK‘. A list of the principal subsidiaries is included in these notes.
KAS BANK is a European wholesale bank offering a wide range of securities and investor services. KAS BANK’s focus is on value-added services in the field of treasury, risk management and management information, which have evolved from its basic services of investment administration, custody, clearing and settlement.
KAS BANK’s main target groups are institutional investors (pension funds, insurance companies, investment funds and asset managers) and financial institutions (banks and brokers). KAS BANK does not provide active asset management services itself and is independent, guaranteeing its impartiality and autonomy. KAS BANK aims to achieve a low risk profile.
The 2009 financial statements were prepared by the Managing Board on 3 March 2010 and were considered in the meeting of the Supervisory Board held on 3 March 2010. They will be presented to the General Meeting of Shareholders for adoption on 21 April 2010.
Statement of compliance
The consolidated financial statements of KAS BANK have been prepared in accordance with International Financial Reporting Standards (IFRS) as adopted within the European Union and with Part 9, Book 2, of the Netherlands Civil Code.
Basis of consolidation
Subsidiaries are entities which are controlled by KAS BANK. Control of an entity exists if KAS BANK is able directly or indirectly to govern its financial and operating policies in order to obtain economic benefits from its activities. Subsidiaries are consolidated as from the date on which control is acquired and are eliminated from the consolidation as from the date on which KAS BANK relinquishes control.
As at 31 December 2009, the subsidiaries include:
| – Amsterdam Depositary Company N.V. | Amsterdam |
| – KAS Derivaten Clearing N.V. | Amsterdam |
| – KAS Fondsbeheer B.V. | Amsterdam |
| – KAS BANK Effectenbewaarbedrijf N.V. | Amsterdam |
| – KAS Trust B.V. | Amsterdam |
| – KAS Servicing B.V. | Amsterdam |
| – KAS Participatiemaatschappij B.V. | Amsterdam |
| – Centrum voor Fondsenadministratie B.V. | Amsterdam |
| – Addition Knowledge House B.V. | Amsterdam |
| – KAS BANK OG Spuistraat B.V. (with effect from 1 January 2009) | Amsterdam |
| – KAS BANK OG NZVW B.V. (with effect from 1 January 2009) | Amsterdam |
| – KAS Europe BVBA (with effect from 19 May 2008) | Brussels |
| – KB Deutschland Holding GmbH (with effect from 16 May 2008) | Wiesbaden |
| o KAS Investment Servicing GmbH (with effect from 1 July 2008) | Wiesbaden |
A complete list of subsidiaries has been deposited with the Trade Register of the Amsterdam Chamber of Commerce. Apart from an interest of 50% plus one share in Addition Knowledge House B.V., KAS BANK’s interest in all the subsidiaries is 100%.
A minority interest is presented separately in the consolidated balance sheet as a component of shareholders‘ equity. The result for the period attributable to the minority interest is also separately presented.
Intragroup balances, any unrealised gains and losses on transactions within the group and income and expenses relating to such transactions have been eliminated in the preparation of the financial statements.
Basis of preparation of the financial statements
The accounting policies have been applied consistently to KAS BANK and its subsidiaries for all periods presented in these financial statements. The financial statements are presented in thousands of euros, unless stated otherwise. The amounts presented in the tables have been computed using figures which have not been rounded and it is therefore possible for differences to occur due to the effects of rounding. The euro is also KAS BANK’s functional currency.
To facilitate comparison, the comparative figures have been restated where necessary.
An item is classified as exceptional if it does not arise in connection with ordinary operating activities. Exceptional items are cleared with the Supervisory Board and the Audit Committee and their treatment is consistently applied.
Basis of measurement
The financial statements have been prepared on a historical cost basis except for the following:
| • |
Investments at amortised cost |
| • |
Investments at fair value through profit or loss |
| • |
Available-for-sale investments |
| • |
Reverse repurchase agreements |
| • |
Derivative financial instruments |
| • |
Land and buildings in use by the company |
| • |
Employee benefits |
| • |
Share-based payments |
Income is recognised in the income statement when an increase in future economic benefits related to an increase in an asset or a decrease in a liability has arisen that can be measured reliably. Expenses are recognised in the income statement when a decrease in future economic benefits related to a decrease in an asset or an increase in a liability has arisen that can be measured reliably.
Use of estimates and judgements
In preparing the financial statements in compliance with IFRS, the management is required to form judgements and make estimates and assumptions which affect the items presented in the balance sheet and explanatory notes and the items presented in the income statement and the statement of comprehensive income for the reporting period. Although these estimates are based on past experience and take into account the latest developments, the reality may differ. Estimates and underlying assumptions are reviewed on an ongoing basis. Revisions to accounting estimates are recognised in the period in which the estimate is revised and in any future periods affected.
In particular, information about significant areas of estimation uncertainty and critical judgements in applying accounting policies that have the most significant effect on the amount recognised in the financial statements are described in the following notes:
| • |
Note 10; impairment losses on available-for-sale investments and investments at amortised cost |
| • |
Note 17; measurement of derivative financial instruments |
| • |
Note 24; measurement of land and buildings in use by the company |
| • |
Note 25; measurement of the recoverable amount of cash-generating units including goodwill |
| • |
Note 32; measurement of defined benefit obligations |
| • |
Notes 51 and 52; measurement of share-based payments. |
New and amended standards and interpretations issued by the IASB
The following new standards, amendments to existing standards and interpretations have been issued by the International Accounting Standards Board (IASB), adopted within the European Union and applied for the first time (where applicable) in these financial statements:
| • |
Amendment to IFRS 7 Financial Instruments: Disclosures: This amendment concerns additional disclosures relating to the reclassification of financial assets from investments at fair value through profit or loss and/or available-for-sale investments. Reclassifications of this kind do not apply in the case of KAS BANK. The amendment also requires additional disclosures relating to financial instruments carried at fair value in the balance sheet. This requirement has led to additional disclosures. |
| • |
IFRS 8 Operating Segments: This standard replaces IAS 14 Segment Reporting. Segment information has to be disclosed on the basis of internal reports regularly used by the Managing Board in assessing developments affecting individual segments and allocating resources. This change has led to a different presentation of the segment information. |
| • |
IAS 1 (revised) Presentation of Financial Statements: This revision requires a consolidated statement of changes in equity to be included in the financial statements as one of the primary statements. In the statement, KAS BANK presents all changes in equity concerned with shareholders in their capacity as shareholder separately from changes in equity connected with income and expenses that are recognised either directly in equity or in the income statement. The revised standard has led to a different presentation and additional information in the primary statements and accompanying notes. |
| • |
In addition, the following amendments to standards and interpretations have been evaluated and it has been decided that they do not have any impact on KAS BANK: amendments to various standards resulting from the Annual Improvements Project 2008; amendment to IFRS 2 Share-Based Payments; amendment to IAS 23 Borrowing Costs; amendment to IAS 27 Consolidated and Separate Financial Statements; amendment to IAS 32 Financial Instruments: Presentation; amendment to IAS 39 Financial Instruments: Recognition and Measurement; IFRIC 12 Service Concession Arrangements; IFRIC 13 Customer Loyalty Programmes; IFRIC 15 Agreements for the Construction of Real Estate; and IFRIC 16 Hedges of a Net Investment in a Foreign Operation. |
Where applicable, the comparative figures have been restated as a result of the above changes.
Set-off
Amounts receivable and payable and due on demand or maturing at the same time which relate to one person or legal entity or group of jointly and severally liable legal entities are shown net in the balance sheet where the bank has a right of set-off and it is the intention to settle the liability on a net basis or realise the asset at the same time that the liability is settled. Income and expenses are not set off unless related to hedging or to assets and liabilities which are set off in accordance with the foregoing.
Transactions in foreign currencies
Income and expenses relating to transactions in foreign currencies are translated at the exchange rate prevailing on the transaction date. Monetary assets and liabilities denominated in foreign currencies are translated on the balance sheet date at the known exchange rate on that date. Exchange gains and losses arising on the aforesaid transactions and carrying amounts are recognised in the income statement in income from investments at fair value through profit or loss.
Unrealised exchange gains and losses on non-monetary financial assets are part of the total movement in the carrying amount of the asset. In the case of non-monetary financial assets which are classified as investments at fair value through profit or loss or as derivative financial instruments, exchange gains and losses are part of the gains and losses on the financial asset concerned. In the case of non-monetary assets which are classified as available for sale, unrealised exchange gains and losses are recognised directly in equity.
Financial instruments
KAS BANK’s financial instruments consist of cash and deposits at the central bank, banks, loans and advances, funds entrusted, investments at fair value through profit or loss, available-for-sale investments, reverse repurchase agreements and derivative financial instruments.
Recognition and derecognition
A financial instrument is recognised if KAS BANK becomes a party to the contractual provisions of the instrument. Financial assets are derecognised if KAS BANK’s contractual rights to the cash flows from these financial assets expire or if KAS BANK transfers the financial asset to another party without retaining control or substantially all risks and rewards of the asset. Financial liabilities are derecognised if KAS BANK’s obligations specified in the contract expire or are discharged or cancelled.
All purchases and sales of financial assets are recognised on the transaction date, i.e. the date on which KAS BANK commits itself to purchasing or selling the asset.
Measurement on initial recognition
On initial recognition, financial instruments are measured at fair value plus, in the case of instruments not subsequently carried at fair value through profit or loss, any directly attributable transaction costs.
Measurement at fair value
The fair values represent the amounts for which the financial instruments could be exchanged on a realistic economic basis between knowledgeable, willing parties in an arm’s length transaction.
The fair values of financial instruments are measured on three levels:
| • |
Level 1: The fair values are based on quoted bid prices on active markets. A financial instrument is considered to be listed on an active market if a quoted price is regularly available and such prices reflect current, regularly occurring arm’s-length transactions on that market. |
||||||||||||
| • |
Level 2: In the case of financial instruments for which an active market does not exist or quoted bid prices are not available, use is made of valuation methods. Valuation methods involve such things as reference to recent transactions conducted on a realistic economic basis between knowledgeable, willing parties or reference to similar instruments for which market prices or valuation models are available. The input data for the valuation models is observable market-related data obtained from reliable external sources. The valuation methods used are internally evaluated and approved. Tests are performed to determine whether the measurement process has produced an appropriate fair value for an item and whether the carrying amounts thus arrived at have been properly reflected through profit or loss. The main observable market-related data used is obtained from:
|
||||||||||||
| • |
Level 3: Measurement is based on valuation models using variables that are not related to observable market related data. |
Non-listed equity instruments whose fair value cannot be measured reliably are carried at cost.
Fair values reflect the credit risk embodied in a financial instrument and, where applicable, take account of the credit risk of both KAS BANK and the counterparty.
Investments at amortised cost
Investments at amortised cost are non-derivative financial instruments which are not quoted on an active market and on which interest is payable at a fixed or floating rate. These arise when KAS BANK has raised funds or advanced funds to a client where it is not the intention to sell the financial instrument immediately or in the near future. The principal sums are accounted for in the balance sheet in banks, loans and advances and funds entrusted. Interest income and expenses are recognised in net interest in the income statement, using the effective interest method.
Investments at fair value through profit or loss
There are two categories of investments at fair value through profit or loss:
| • |
Investments held for trading: Accounted for under this heading are those securities that are acquired in order to generate short-term profits. |
| • |
Investments classified as investments at fair value through profit or loss by the Managing Board. This classification is only made if the related investments are managed on a fair-value basis or in the interests of consistency of approach. |
Investments at fair value through profit or loss are measured at fair value on initial recognition, with directly attributable transaction costs recognised as an expense as and when incurred. The investments are subsequently carried at fair value. All realised and unrealised gains and losses are recognised in the income statement under investments at fair value through profit or loss.
Available-for-sale investments
Securities which are held for an indefinite period and can be sold if cash is needed or if warranted by movements in market value are classified as available-for-sale investments. After initial recognition, availablefor-sale investments are carried at fair value on the balance sheet date.
Except for impairments and, in the case of monetary items, exchange differences, unrealised gains and losses arising out of movements in the fair value are accounted for in equity. If the securities are sold or in the event of impairment, the attributable accrued gains and losses recognised directly in equity are recognised in the income statement under available-for-sale investments and impairment losses, as the case may be.
If these securities are interest-bearing, the interest, calculated using the effective interest method, is recognised in interest income in the income statement. Dividends received are accounted for in the income statement in income from available-for-sale investments on the date that KAS BANK’s right to receive payment is established, which in the case of quoted securities is the ex-dividend date.
Reverse repurchase agreements
Securities which are purchased subject to the binding condition that they will be sold back in the future at a predetermined price (reverse repurchase agreements) are accounted for as secured loans. The monetary receivable, including accrued interest, is included in reverse repurchase agreements on the assets side of the balance sheet. Securities acquired by means of reverse repurchase agreements are used mainly as collateral and are not carried on the balance sheet. The interest on reverse repurchase agreements – calculated using the effective interest method – is amortised over the term of the agreement and accounted for in interest income in the income statement.
Derivative financial instruments
KAS BANK uses derivative financial instruments (derivatives) mainly to hedge currency, credit, price and interest-rate risks arising out of its operating, financing and investing activities.
Derivatives, including currency, interest-rate, credit and share contracts, are measured at fair value on initial recognition, with directly attributable transaction costs expensed in income from investments at fair value through profit or loss as and when incurred. After initial recognition, these derivative financial instruments are carried at fair value, with gains and losses recognised in income from investments at fair value through profit or loss in the income statement.
Derivatives are recognised as assets if the fair value is positive and as liabilities if the fair value is negative.
Hedge accounting
KAS BANK employs hedge accounting by designating derivative financial instruments as hedges against changes in the fair value of the fixed-income assets on the balance sheet relating to movements in interest rates. All hedge accounting relationships are documented and their effectiveness is periodically tested.
A movement in the fair value of a hedging transaction which has been classified as a fair-value hedge is accounted for in net interest in the income statement. The simultaneous movement in the fair value of the hedged asset or liability which is attributable to the specific hedged risk is also accounted for in net interest in the income statement. Unhedged movements in the fair value of assets or liabilities classified as available for sale are accounted for in the revaluation reserve.
If a transaction relating to an interest-bearing instrument covered by a fair value hedge no longer satisfies the hedge accounting criteria or the hedging relationship is terminated, the carrying amount of the hedged asset or liability is adjusted through net interest in the income statement over the remaining term, using the effective interest method.
Some transactions in derivatives which KAS BANK regards as economically effective hedging transactions in the context of its risk control policy do not qualify for hedge accounting. Gains and losses on these transactions in derivatives are recognised directly in income from investments at fair value through profit or loss in the income statement.
Property and equipment
Property in use by the bank is carried in the balance sheet at fair value as determined by an external appraiser, less depreciation. Part of the property is appraised periodically. Changes in value as a result of periodic reappraisal, less a provision for deferred tax liabilities, are accounted for in equity. Depreciation is charged to the income statement on a straight-line basis over the estimated useful life of the property. No depreciation is charged on land. The estimated useful life of the buildings is fifty years.
Equipment is stated at cost, less accumulated depreciation and impairment losses. Depreciation is charged to the income statement on a straight-line basis over the estimated useful life. Machines and computer hardware are written off over three years, furniture over five years, technical installations over ten years and alterations to leased property over the term of the lease. The residual value is assessed annually.
Intangible assets
Goodwill
Goodwill arises on the acquisition of subsidiaries. It is the difference between the price paid for an acquisition (including acquisition costs) and the fair value of the identifiable assets, liabilities and contingent liabilities acquired at the time of acquisition. If the difference is negative, the loss is recognised immediately. On initial recognition, goodwill is measured at cost less cumulative impairment losses. Goodwill is not amortised.
Software
Software purchased from third parties and software development costs are capitalised if they can be directly related to the production of identifiable software which will probably generate economic benefits for KAS BANK for more than one year. The capitalised costs concern directly attributable costs, including the costs of staff employed on the development of the software. Capitalised development costs are recognised at cost less accumulated amortisation and impairment losses. Amortisation is charged to the income statement on a straight line basis over the estimated useful life, which is three years.
Other intangible assets
Other intangible assets comprise separately identified assets deriving from the acquisition of subsidiaries, viz. customer bases and licences. At the time of acquisition, these intangible assets are measured at fair value. Customer bases and licences are subsequently carried at cost less cumulative amortisation and impairment losses. Amortisation is charged on a straight-line basis over the estimated useful life. The estimated useful life of the customer bases depends on management estimates and lies between five and 15 years. The estimated useful life of licences is five years.
Provisions
A provision is recognised in the balance sheet when KAS BANK has a present obligation (legal or constructive) as a result of a past event, a reliable estimate can be made of the amount of the obligation and it is probable that an outflow of resources embodying economic benefits will be required to settle the obligation. The amount of the provision is calculated by discounting the expected future cash flows using a discount rate before tax reflecting the current market estimates of the time value of money and the specific risks relating to the obligation. The amount added to provisions is recognised in the income statement in other administrative expenses, with the carrying amount of the provisions presented as such on the face of the balance sheet.
Loss-making contracts
A provision is recognised in the balance sheet for loss-making contracts when the benefits which KAS BANK can expect to obtain from a contract are less than the unavoidable cost of settling the obligations under the contract. The amount of the provision is measured at the lower of the present value of the expected costs of terminating the contract and the present value of the expected net costs of continuing the contract. Before a provision is recognised, KAS BANK may recognise an impairment loss in relation to the contract concerned.
Lease agreements
A lease agreement is classified as a finance lease if substantially all the risks and rewards incidental to ownership are transferred from the lessor to KAS BANK. In all other cases, lease agreements are classified as operating leases.
Assets acquired via a finance lease are carried at the lower of their fair value and the present value of the nominal lease payments upon inception of the lease, less accumulated depreciation and impairment losses.
The discount rate used to calculate the present value of the nominal lease payments is the interest rate implicit in the lease. Capitalised finance lease assets are depreciated in accordance with the criteria stated in relation to property and equipment.
Lease payments made under an operating lease are recognised in the income statement on a straight-line basis over the term of the lease. If an operating lease contract is terminated before expiry, any penalties are recognised in the period in which the lease contract is terminated.
Impairment losses
Financial assets at amortised cost
At each balance sheet date, an assessment is made of whether there is objective evidence of impairment.
A financial asset is impaired and impairment losses are incurred if, and only if, there is objective evidence of impairment as a result of one or more events that occurred after the initial recognition of the asset (a ‚loss event‘) and that loss event (or events) has an impact on the estimated future cash flows of the financial asset that can be reliably estimated.
The impairment loss is the difference between the asset’s amortised cost and the value of future cash flows, discounted at the financial asset’s original effective interest rate. Impairment losses are recognised in impairment losses in the income statement.
If the financial asset is collateralised, account is taken of future cash flows that may result from foreclosure of the collateral, less costs of selling, irrespective of whether foreclosure is probable.
If, in a subsequent period, the amount of the impairment loss decreases and the decrease can be related objectively to an event occurring after the impairment was recognised, the previously recognised impairment loss is reversed and the reversal is accounted for in impairment losses in the income statement.
Financial assets at fair value
At each balance sheet date, an assessment is made of whether there is objective evidence of impairment. An asset is regarded as impaired if there is objective evidence that one or more events have had a negative impact on the expected future cash flows from that asset.
Objective evidence of impairment may be provided by:
| • |
significant financial problems affecting the issuing institution; |
| • |
default; |
| • |
concessions on the part of the bank to the borrower for economic or legal reasons connected with the financial problems facing the borrower which the bank would not consider making in other ci rcu msta nces; |
| • |
probability of financial failure or other financial reorganisation of the borrower; or |
| • |
collapse of an active market for the financial asset concerned because of financial difficulties. |
Additionally, in the case of equity investments, objective evidence of impairment is provided by a prolonged (longer than nine months) or significant (more than 25%) drop in the fair value below cost.
If there is objective evidence of impairment of an available-for-sale investment, the difference between cost and current fair value, less any previously recognised impairment losses, is transferred from equity to impairment losses in the income statement.
If, in the case of interest-bearing securities, in a subsequent period, the amount of the impairment loss decreases and the decrease can be related objectively to an event occurring after the impairment was recognised, the previously recognised impairment loss is reversed and the reversal is accounted for in impairment losses in the income statement. If the decrease in the amount of the impairment loss cannot be related objectively to an event occurring after the impairment was recognised, the decrease in the amount of the impairment is accounted for in the result on investments in the income statement. Reversals of previously recognised impairment losses relating to equity instruments are credited to equity.
Non-financial assets
The carrying amount of KAS BANK’s assets, excluding deferred tax assets, is reviewed at each balance sheet date to ascertain whether there are any objective indications that an asset may be impaired. If any such indication exists, an estimate is made of the recoverable amount of the asset. Impairment losses are recognised in impairment losses in the income statement.
In the case of intangible assets and goodwill relating to assets that are not yet in use, an estimate of the recoverable amount is made at the same time each year.
For an individual asset or a cash-generating unit, the recoverable amount is equal to the value in use or the fair value less costs to seII. In measuring the value in use, the present value of the estimated future cash flows is calculated using a discount rate before tax reflecting both the current market estimates of the time value of money and the specific risks relating to the asset concerned. For impairment testing, assets are grouped into the smallest identifiable cash-generating units on the basis of continuing operations that are substantially independent of other assets and groups of assets. For the purposes of impairment testing, the goodwill
acquired in a business combination is attributed to cash-generating units that are expected to profit from the synergistic gains of the business combination.
An impairment loss is recognised if the carrying amount of an asset or a cash-generating unit of which the asset forms part is higher than the estimated recoverable amount. Impairment losses recognised in respect of cash-generating units are first deducted from the carrying amount of any goodwill attributed to the units and then from the carrying amounts of the other assets in the unit (or group of units) on a pro rata basis.
Impairment losses recognised in respect of goodwill are not reversed. In the case of other assets, previously recognised impairment losses are assessed on each balance sheet date for indications that the loss has diminished or no longer exists. An impairment loss is reversed if the estimates used as the basis for measuring the recoverable amount have changed. An impairment loss is only reversed as long as the resultant carrying amount of the asset does not exceed the carrying amount of the asset net of depreciation or amortisation which would have applied if no impairment loss had been recognised.
Equity
Share capital
KAS BANK’s authorised capital comprises ordinary shares and preference shares. The issued and fully paid registered ordinary shares are accounted for in the balance sheet in equity. The issued and fully paid registered preference shares are accounted for in the balance sheet in other liabilities. The preference share capital is classified as borrowed capital because, pursuant to Article 25 of the Articles of Association, dividend distributions are not voluntary. Dividends on these shares are accounted for in interest expense in the income statement.
Repurchase of own shares
Upon the repurchase of shares in the company’s capital which are included in equity in the balance sheet, the consideration paid, including directly attributable costs, is recognised as a movement in equity. Repurchased shares which are not cancelled are deducted from equity.
Dividend on shares
Dividends paid on shares are recognised in equity in the period in which they are approved by the shareholders. Dividend for the year which is declared after the balance sheet date is disclosed in the notes on equity and the other information.
Interest income and expense
Interest income and expense in respect of financial instruments are accounted for in the income statement using the effective interest method. Movements in the fair value of derivative financial instruments used for hedge accounting are accounted for in net interest in the income statement.
Commission income and expense
The commission which KAS BANK earns on a wide range of services can be divided into two broad categories: commission earned on services provided over a period, for which the clients are invoiced periodically, and commission earned on transaction-driven services. Commission earned on services which are provided over an extended period is allocated to the period on a pro rata basis. Commission earned on transaction-driven services is accounted for directly in the income statement.
Employee benefits
Pension obligation
KAS BANK’s pension plans are defined contribution and defined benefit plans. KAS BANK has delegated the management of the Dutch defined benefit plans to Stichting Pensioenfonds van KAS BANK, which has reinsured the obligations fully with a life insurance company. The pensions of UK employees are managed by the KAS UK Retirement Benefit Scheme, which has reinsured the obligations with a UK life insurance company. The pension plan for the employees in Germany is a defined contribution plan.
Defined contribution plan
The defined contribution plan is a retirement benefit scheme under which KAS BANK makes fixed contributions to a separate entity and has no legal or constructive obligation to make any additional payments. The plan applies to members of the Managing Board and the employees in Germany. When the amounts become payable, the expenses related to this plan are included in the income statement under staff costs. For the defined contribution plan, the company does not run any actuarial risks and no pension obligations are included in the balance sheet.
Defined benefit plan
For the defined benefit plan the company incurs the actuarial risks and the employee is assured of a defined benefit upon reaching pensionable age. The pension obligations are determined individually for each plan by deducting the fair value of the plan assets from the present value of promised retirement benefits at the balance sheet date, taking into account unrecognised past-service costs. Future retirement benefits are calculated on the basis of estimates of the rights vested in employees in exchange for their services in the reporting period and previous periods. These defined benefits are discounted at the yield at the reporting date on high-grade corporate bonds that have maturity dates matching those when the benefits become payable. The calculation is performed annually by an actuary using the projected unit credit method.
The net benefit expense is accounted for in staff costs in the income statement and the net benefit obligation is accounted for in employee benefits in the balance sheet. Actuarial gains and losses result from changes in actuarial assumptions and differences between the actuarial assumptions at the beginning of the year and the realised results at year-end. Actuarial gains and losses are accounted for in equity.
If the benefits under a plan are adjusted, the portion of the adjusted benefits which relates to employees‘ past service is recognised in staff costs in the income statement over the average period until the benefits become vested. Adjustments to benefits which become vested immediately are accounted for in staff costs in the income statement.
Under the pension administration agreement between KAS BANK and the pension fund, KAS BANK is able to include pension plan assets in the KAS BANK balance sheet without restriction.
Other long-term employee benefits
KAS BANK’s net liability in respect of long-term employee benefits other than retirement benefit provision comprises future remuneration earned by employees in exchange for their services in the reporting period and previous periods, taking into account mortality risk and the probability of employees remaining in company service and participating in the plans. The liability is discounted to present value and recognised in the balance sheet in employee benefits.
Expenses are accounted for in staff costs in the income statement.
Share-based payments
Part of the remuneration given to members of the Managing Board and other staff in exchange for service rendered takes the form of share-based payments. The cost of the service received is measured on the basis of the fair value of the shares or options granted on the date of award. The fair value is accounted for in staff costs in the income statement over the vesting period, with a corresponding movement in equity.
The value of the options granted is calculated using the trinomial model, taking into account the exercise price of the options, the share price at grant date, the risk-free interest rate, the volatility of KAS BANK shares during the vesting period of the options and the expected dividend yield. In the case of such payments which are granted unconditionally, terms and conditions without a market basis are taken into account by adjusting the number of shares or options used to measure the cost of the service rendered so that the cumulative amount recognised in the income statement reflects the number of shares or options ultimately becoming vested.
Short-term employee benefits
Short-term employee benefits relate to periodically paid remuneration and variable remuneration accounted for in staff costs in the income statement as and when the related service is rendered. A provision is recognised for the amount expected to be paid under a variable-remuneration or a profit-sharing plan if KAS BANK has a present legal or constructive obligation to pay this amount as a result of past service provided by the employee and the obligation can be estimated reliably.
Tax
Tax expense
Tax on the profit or loss for the periods presented comprises the tax expense payable, eligible for set-off and deferred in respect of the reporting period. Tax expense is recognised in the income statement, except insofar as it relates to items recognised directly in equity, in which case the tax is recognised in equity.
The tax payable and eligible for set-off in respect of the financial year is the expected liability in respect of the taxable profit/loss for the year, calculated using the tax rates ruling on the balance sheet date, and adjustments to the tax payable in respect of prior years.
Deferred tax assets and liabilities
Deferred tax assets and liabilities relate to differences between the carrying amounts and tax bases of certain assets and liabilities. The deferred tax asset or liability is determined on the basis of the current tax rate and is recognised at face value. A deferred tax asset is recognised if it is probable that taxable profits will become available in future against which it can be set off. The carrying amount of the deferred tax assets is assessed on each balance sheet date.
Deferred tax assets and liabilities are set off where there is a legally enforceable right to set off such assets and liabilities and they relate to the same entity.
Earnings per share
KAS BANK presents basic and diluted earnings per share data for its ordinary share capital. The basic earnings per share are calculated by dividing the profit or loss attributable to ordinary shareholders of KAS BANK by the weighted average of the number of ordinary shares in issue during the period. Diluted earnings per share are determined by adjusting the profit or loss attributable to ordinary shareholders and the weighted average number of ordinary shares in issue for the effects of all the dilutive potential ordinary shares, including share options and conditionally awarded shares granted to employees and the members of the Managing Board.
Securities lending transactions
Securities lending transactions are generally entered into with securities as collateral. The related assets and liabilities in the form of securities are not recognised in the balance sheet. Securities received as collateral may be repledged. Collateral received in the form of cash is accounted for in banks and funds entrusted.
Trust activities
Through the vehicle of KAS Trust B.V., KAS BANK acts as trustee in connection with the holding or placing of assets on behalf of third parties. Such assets do not constitute assets of the bank and are not included in the financial statements.
Cash flow statement
The cash flow statement has been prepared by the indirect method and shows the source of the cash which became available in the reporting period. Cash flows are divided into three categories: operating activities, investing activities and financing activities.
Cash and cash equivalents is understood to mean cash deposits at the central bank and balances due on demand from other credit institutions, the latter being accounted for in banks.
Segment information
KAS BANK discloses segment information for the operating and geographical segments. An operating segment is a strategic business segment on which internal reports are regularly submitted to the Managing Board, on the basis of which the Managing Board evaluates the performance of the segment and allocates resources to it.
A geographical segment is defined by the location where the revenues are generated.
Segment results comprise results which are directly attributable or may reasonably be allocated to the segment. Segment information is based on the same accounting policies as are used for KAS BANK’s consolidated balance sheet and income statement.
Custody and registration of securities and derivatives
Securities other than those kept as specifically numbered certificates and those not covered by the Giro Securities Transfer Act are held in safe custody by KAS BANK Effectenbewaarbedrijf N.V. (KAS Depositary Trust Company) or KAS Nominees Ltd. The rights and obligations arising from third-party positions in derivatives are vested in KAS Derivaten Clearing N.V. Since clients‘ securities and derivatives are thus divorced from the company’s assets, they are not included in the balance sheet.
New standards and interpretations not yet adopted
A number of new standards, amendments to standards and interpretations issued by the IASB were not yet effective in 2009 and have not been applied in preparing these financial statements. They will be applied with effect from 2010 unless otherwise indicated:
| • |
Amendment of IFRS 1 First-Time Adoption of IFRS (endorsed by the European Union): this amendment is not relevant to KAS BANK because KAS BANK has been applying the IFRS standards since 2005. |
| • |
Amendment of IFRS 2 Share-Based Payments (not yet endorsed by the European Union): The amendment relates to the cash settlement of share-based payments within a group. This amendment will not affect KAS BANK because share-based payments are settled in shares. |
| • |
IFRS 3 (revised) Business Combinations (endorsed by the European Union): The revised standard concerns the treatment of acquisitions with respect to cost, goodwill, part purchase and the disposal of investments. The revised version of IFRS 3 will only affect future acquisitions made by KAS BANK. |
| • |
IFRS 9 Financial Instruments (not yet endorsed by the European Union): This new standard is the result of the first phase of the IASB’s project to replace IAS 39 Financial Instruments: Recognition and Measurement and deals with the classification and measurement of financial instruments. This standard becomes mandatory with effect from 2013 but may be applied before that date when it has been endorsed by the European Union. KAS BANK has not yet taken a decision concerning the year with effect from which this new standard will be applied. KAS BANK is currently assessing the impact of IFRS 9. |
| • |
Amendment of IAS 27 Consolidated and Separate Financial Statements (endorsed by the European Union): The amended standard stipulates that changes in the group’s ownership of a subsidiary, while still retaining control, are accounted for as share transactions. If the group no longer has control of the entity concerned, any residual interest in the former subsidiary is to be recognised at fair value through profit or loss. The amendment to IAS 27 is not expected to have any impact on the financial statements. |
| • |
Amendment of IAS 39 Financial Instruments: Recognition and Measurement (endorsed by the European Union): The amendment clarifies the existing policies to be applied in determining whether specific risks or parts of cash flows qualified for allocation to a hedge relationship. This amendment is not expected to affect KAS BANK. |
| • |
IFRIC 9 Reassessment of Embedded Derivatives (endorsed by the European Union): IFRIC 9 concludes that an entity must assess whether an embedded derivative is required to be separated from the host contract and accounted for as a derivative when the entity first becomes a party to the contract. The amendment to IFRIC 9 requires an entity also to carry out an assessment or reassessment after reclassification of an asset. KAS BANK does not expect this amendment to have any impact on the future financial statements. |
| • |
IFRIC 17 Distribution of Non-Cash Assets to Owners (endorsed by the European Union): Not relevant to KAS BANK. |
| • |
IFRIC 18 Transfer of Assets from Customers (endorsed by the European Union): Not relevant to KAS BANK. |
| • |
Annual Improvements 2009 (not yet endorsed by the European Union): With the exception of the change to IFRS 8, not relevant to KAS BANK. |
Notes to the consolidated income statement
1. Interest income
Included in this item are income from lending and related transactions and other income in the nature of interest. Interest income not qualifying for set -off is included gross.
| (in thousands of euros) | 2009 | 2008 |
| This item comprises interest and similar income from: | ||
| Loans and advances | 33,839 | 206,219 |
| Loans and advances subject to impairment | ||
| Total loans and advances | 33,839 | 206,219 |
| Available-for-sale investments | 32,605 | 42,716 |
| Available-for-sale investments subject to impairment | 740 | |
| Total available-for-sale investments | 33,345 | 42,716 |
| Reverse repurchase agreements | 6,373 | 60,164 |
| Derivative financial instruments | 10,350 | 1,874 |
| Investments at fair value through profit or loss | 2,983 | 187 |
| Gains and losses in the fair value of fair value hedges | -6,316 | -2,292 |
| Gains and losses in the fair value of positions hedged by fair value hedges | 6,312 | 2,292 |
| Total | 86,886 | 311,160 |
2. Interest expense
This item comprises the costs of borrowing and related transactions and other expense in the nature of interest. Interest expense not qualifying for set-off is included gross.
| (in thousands of euros) | 2009 | 2008 |
| This item comprises interest and similar income from: | ||
| Financial instruments at amortised cost | 39,029 | 280,676 |
| Derivative financial instruments | 17,272 | 1,607 |
| Total | 56,301 | 282,283 |
3. Commission income
This item includes income from custody, settlement, securities lending, derivatives clearing services and addedvalue services.
4. Commission expense
This item includes expenses relating to custody, settlement, securities lending and derivatives clearing services.
| (in thousands of euros) | 2009 | 2008 |
| Net commission by type of service: | ||
| Custody & investment management services | 30,073 | 28,676 |
| Clearing & Settlement | 33,844 | 37,626 |
| Securities lending | 5,118 | 17,163 |
| Other commission | 6,294 | 5,748 |
| Total | 75,329 | 89,213 |
5. Result on investments
| (in thousands of euros) | 2009 | 2008 |
| Investments held for trading | ||
| Changes in the fair value of securities and derivatives | -222 | -4,292 |
| Dividends received | 53 | 25 |
| Foreign-exchange trading results | 11,657 | 12,097 |
| Total | 11,488 | 7,830 |
| Investments classified as assets measured at fair value through profit or loss | ||
| Changes in the fair value of securities | 2,688 | 3,925 |
| Total investments at fair value through profit or loss | 14,176 | 11,755 |
| Available-for-sale investments | ||
| Result on sales of securities | 8,055 | 932 |
| Dividends received | 1,808 | 883 |
| Total available-for-sale investments | 9,863 | 1,815 |
| Operating result on investments | 24,039 | 13,570 |
| Exceptional result on investments | 4,874 | -2,684 |
| Total result on investments | 28,913 | 10,886 |
Of the exceptional result on investments, a loss of €1.1 million (2008: €2.7 million loss) is accounted for by the negative fair value of an interest rate derivative. This is offset by a gain from the increases in the value of investments due to development of interest rates, which, in conformity with accounting standards, is recognised in equity (revaluation reserve). The item also includes an exceptional result of €0.3 million negative for written options.
Also included in the exceptional result on investments is an amount of €4.3 million due to the recov ery in the prices of securities on which an impairment loss was recognised in 2008. This price recovery cannot, however, be objectively related to events since the impairment loss was recognised. Finally, the exceptional result on investments includes a gain of €2.0 million on shares sold.
6. Other income
This item includes non-recurring income indirectly generated by operations which cannot be classed under any other heading.
7. Staff costs
| (in thousands of euros) | 2009 | 2008 |
| Salaries | 44,823 | 39,296 |
| Share-based payments | 796 | 647 |
| Pension costs | 4,178 | 5,550 |
| Other social security charges | 5,618 | 5,553 |
| Other staff costs | 11,877 | 19,095 |
| Total | 67,292 | 70,141 |
Other staff costs includes the cost of temporary staff (2009: €6.9 million; 2008: €12.9 million) and expenses arising from secondary terms of employment (2009: €3.2 million; 2008: €2.8 million).
Pension costs
The expenses regarding the defined benefit plan are €2.7 million (2008: €4.2 million). The expenses regarding the defined contribution plan for member s of the Managing Board are €0.2 million (2008: €0.2 million). The pension costs also include employee benefits amounting to €1.1 million (2008: €1.0 million) with regard to the life-course savings scheme.
The pension costs for staff in the United Kingdom and Germany totalled €0.2 million (2008: €0.2 million).
| Number of employees | Number of employees | Full-time equivalents | ||
| 2009 | 2008 | 2009 | 2008 | |
| Average (including temporary staff) | ||||
| Netherlands | 799 | 825 | 753 | 777 |
| United Kingdom | 23 | 20 | 22 | 20 |
| Germany | 21 | 17 | 20 | 16 |
| Total | 843 | 862 | 795 | 813 |
| Year-end (including temporary staff) | ||||
| Netherlands | 787 | 828 | 740 | 780 |
| United Kingdom | 22 | 23 | 21 | 22 |
| Germany | 22 | 17 | 21 | 17 |
| Total | 831 | 868 | 782 | 819 |
8. Other administrative expenses
| (in thousands of euros) | 2009 | 2008 |
| Premises costs | 3,353 | 4,477 |
| ICT costs | 14,662 | 16,098 |
| General overheads | 11,834 | 9,558 |
| Total | 29,849 | 30,133 |
Premises costs in 2008 includes the costs in respect of a loss-making contract relating to leased premises which KAS BANK vacated in 2007. The future proceeds from subletting are expected to be less than the future rental charges. A provision amounting to €0.9 million was recognised in respect of this contract in 2008 (2009: nil).
Included in the general overheads in 2009 are exceptional expenses amounting to €0.8 million in respect of a provision relating to the KAS BANK contribution to the deposit guarantee scheme in connection with the collapse of DSB Bank.
9. Depreciation/amortisation
| (in thousands of euros) | 2009 | 2008 |
| Land and buildings in use by the company | 792 | 792 |
| Other property and equipment | 2,822 | 2,642 |
| Intangible assets | 4,507 | 4,468 |
| Total | 8,121 | 7,902 |
10. Impairment losses
The slight improvement on the international financial markets in 2009 meant that the value of loans and advances and securities stabilised. In a number of individual cases, the bank reversed previously recognised impairments. As a consequence, KAS BANK recognised a net reversal of impairment losses amounting to €0.3 million in 2009 (2008: €73.4 million impairment).
| (in thousands of euros) | 2009 | 2008 |
| Banks and loans and advances | -501 | 35,299 |
| Available-for-sale investments | 240 | 32,890 |
| Goodwill | – | 5,234 |
| Total | -261 | 73,423 |
Banks and loans and advances
KAS BANK extends credit in the form of both cash and securities (securities lending) against the collateral of securities.
Chiefly as a consequence of the financial crisis, some clients have become insolvent while others are expected to be unable to settle their obligations vis-ä-vis KAS BANK fully. The value of the furnished collateral also depends on share prices. The KAS BANK Managing Board periodically makes estimates of the creditworthiness of clients and of any indications justifying the recognition of impairment losses or the reversal of previous impairments. Based on these estimates, the bank reversed several previously recognised impairments, leading to a net reversal of impairment losses totalling €0.5 million (2008: €35.3 million impairment).
Available-for-sale investments
The portfolio of available-for-sale investments is largely made up of shares and bonds. With regard to shares, there is objective evidence of impairment losses representing a net reversal of €0.1 million (2008: €21.9 million impairment) and, with regard to bonds, a net loss of €0.3 million (2008: €11.0 million). The difference between the cost and the current fair value (quoted bid prices in an active market) has been transferred from the revaluation reserve to the income statement.
Intangible assets
The deterioration in market conditions led the bank to make a downward adjustment in the future profit projections for the subsidiary in Germany acquired on 1 July 2008, involving the recognition of an impairment loss of €5.2 million in 2008 in respect of goodwiII. This goodwill impairment loss is not allowable agains t tax. There was no cause to recognise an impairment loss in respect of goodwill in 2009.
11. Tax expense
This item relates to the tax burden for the year on the profit for the year shown by the income statement. The calculation of the tax expense takes account of existing tax facilities, including tax-exempt profit components and non-deductible items. The effective tax rate amounts to 23.1% (2008: 23.0%). The standard tax rate was 25.5% (2008: 25.5%).
| (in thousands of euros) | 2009 | 2008 |
| Tax expense | ||
| Current tax charge for the year | 7,413 | -12,902 |
| Adjustments for prior years | 17 | – |
| 7,430 | -12,902 | |
| Deferred tax: | ||
| Temporary differences and reversals | -80 | 952 |
| Total | 7,350 | -11,950 |
| Reconciliation with effective tax rate | 2009 | % | 2008 | % |
| Result for the period before tax | 31,841 | -51,971 | ||
| Tax at standard tax rate | 8,119 | 25.5 | -13,253 | 25.5 |
| Tax-exempt result on available-for-sale investments | -714 | -2.2 | -236 | 0.5 |
| Non-deductible impairment loss on goodwill | – | – | 1,335 | -2.6 |
| Differences in rates | -307 | -1.0 | – | |
| Non-deductible costs relating to staff options | 203 | 0.6 | 100 | -0.2 |
| Other non-deductible items | 32 | 0.1 | 104 | -0.2 |
| Tax liability for the year | 7,333 | 23.0 | -11,950 | 23.0 |
| Adjustments due to prior-year assessments | 17 | 0.1 | ||
| Tax liability at effective tax rate | 7,350 | 23.1 | -11,950 | 23.0 |
12. Earnings per share
The calculation of the basic and diluted earnings per share at year-end is based on the result attributable to holders of ordinary shares, amounting to €24.6 million profit (2008: €39.9 million loss).
| (in thousands of euros, except where otherwise stated) | 2009 | 2008 |
| Result for the period attributable to equity holders of the bank | 24,581 | -39,933 |
| Issued share capital | 15,699 | 15,699 |
| Own shares held by the company | -1,126 | -920 |
| Weighted average number of ordinary shares | 14,573 | 14,779 |
| Effect of share options and conditionally awarded shares | 104 | 43 |
| Weighted average number of ordinary shares (diluted) | 14,677 | 14,822 |
| Basic earnings per share (in euros) | 1.69 | -2.70 |
| Diluted earnings per share (in euros) | 1.67 | -2.69 |
ASSETS
13. Cash and deposits at the central bank
This item includes all amounts in legal tender and demand deposits with the Central bank.
14. Banks
This item comprises all receivables from credit institutions under official banking industry supervision and from Central banks, other than funds included in cash and deposits at the central bank or investments at fair value through profit or loss and available -for-sale investments.
Included in banks are receivables totalling €18.3 million (2008: €20.1 million) in respect of which a provision for doubtful debts has been recognised amounting to €15.0 million (2008: €15.6 million). The addition to the provision for doubtful debts is presented in the income statement in impairment losses.
| (in thousands of euros) | 31-12-2009 | 31-12-2008 |
| Due on demand from other credit institutions | 2,318,904 | 1,362,627 |
| Not due on demand from other credit institutions – current (29 1 year) | 388,522 | 331,093 |
| Total | 2,707,426 | 1,693,720 |
15. Loans and advances
Included in this item are all amounts receivable, including receivables covered by securities, other than receivables from credit institutions and items in the form of bonds and other fixed-income securities. Lending mainly concerns loans and adv ances to professional clients in the Netherlands and the United Kingdom. Included in loans and advances are receivables totalling €15.2 million (2008: €27.5 million) in respect of which a provision for doubtful debts has been recognised amounting to €13.4 million (2008: €19.7 million). The addition to the provision for doubtful debts is presented in the income statement in impairment losses.
| (in thousands of euros) | 31-12-2009 | 31-12-2008 |
| Advances | 899,798 | 2,425,882 |
| Mortgage loans | 7,384 | 8,051 |
| Total | 907,182 | 2,433,933 |
| Due on demand | 885,400 | 2,375,915 |
| Not due on demand – current (29 1 year) | 14,398 | 49,922 |
| Not due on demand – non-current (>1 year) | 7,384 | 8,096 |
| Total | 907,182 | 2,433,933 |
16. Reverse repurchase agreements
Utilisation of reverse repurchase agreements as collateral was as follows:
| (in thousands of euros) | 31-12-2009 | 31-12-2008 |
| Securities and derivatives clearing | 268,865 | 114,566 |
| Securities lending | 78,749 | 61,599 |
| Total | 347,614 | 176,165 |
All reverse purchase agreements are current.
17. Derivative financial instruments
Derivatives are used exclusively to hedge balance sheet positions.
| (in thousands of euros) | 31-12-2009 | 31-12-2008 |
| Assets | 92,141 | 386,095 |
| Equity and liabilities | -116,144 | -395,689 |
| Total | -24,003 | -9,594 |
| Of which current (≤ 1 year) | -630 | -4,456 |
| Of which non-current (>1 year) | -23,373 | -5,138 |
The open positions on the balance sheet date are presented in the table below, which shows the contract totals and corresponding fair values of the underlying assets and liabilities.
| As at 31 December 2009 (in thousands of euros) |
Face value of contracts with positive fair value | Face value of contracts with negative fair value | Fair value assets | Fair value liabilities |
| Derivatives for risk management purposes to which hedge accounting is not applied | ||||
| Foreign exchange contracts | ||||
| – Forward contracts | 472,117 | 179,388 | 8,395 | 2,332 |
| – Swaps | 3,711,404 | 3,904,907 | 68,517 | 72,278 |
| Total foreign exchange contracts | 4,183,521 | 4,084,295 | 76,912 | 74,610 |
| Interest contracts | ||||
| – Swaps | 122,000 | 735,615 | 12,797 | 29,896 |
| – Swaptions | 170,000 | 170,000 | 2,294 | 2,395 |
| Total interest rate contracts | 292,000 | 905,615 | 15,091 | 32,291 |
| Credit contracts | ||||
| Credit Default Swaps | – | 50,000 | – | 121 |
| Share contracts | ||||
| Options | 6,500 | 67,320 | 3 | 321 |
| Derivatives to which hedge accounting is applied | ||||
| Interest contracts | 60,000 | 530,500 | 135 | 8,801 |
| Total | 4,542,021 | 5,637,730 | 92,141 | 116,144 |
| As at 31 December 2008 (in thousands of euros) | Face value of contracts with positive fair value | Face value of contracts with negative fair value | Fair value assets | Fair value liabilities |
| Derivatives for risk management purposes to which hedge accounting is not applied | ||||
| Foreign exchange contracts | ||||
| – Forward contracts | 2,079,784 | 2,292,910 | 58,522 | 75,608 |
| – Swaps | 4,150,462 | 4,114,250 | 285,204 | 271,924 |
| Total foreign exchange contracts | 6,230,246 | 6,407,160 | 343,726 | 347,532 |
| Interest contracts | ||||
| – Swaps | 437,000 | 725,323 | 28,557 | 33,082 |
| – Swaptions | 120,000 | 120,000 | 13,565 | 13,565 |
| Total interest rate contracts | 557,000 | 845,323 | 42,122 | 46,647 |
| Credit contracts | ||||
| Credit Default Swaps | 5,000 | 15,000 | 27 | 244 |
| Share contracts | ||||
| Options | 33,102 | 1,664 | 68 | – |
| Derivative to which hedge accounting is applied | ||||
| Interest contracts | 18,500 | 25,000 | 152 | 1,266 |
| Total | 6,843,848 | 7,294,147 | 386,095 | 395,689 |
Note 48 contains details of the way in which the fair value is measured.
18. Investments at fair value through profit or loss
Movements in the investments at fair value through profit or loss were as follows:
| 2009 (in thousands of euros) |
Investments held for trading | Investments classified as assets measured at fair value through profit or loss | Total |
| Carrying amount as at 1 January | 5,583 | 26,893 | 32,476 |
| Purchases | – | 125,410 | 125,410 |
| Sales | -5,617 | – | -5,617 |
| Movements in fair value | 34 | 2,327 | 2,361 |
| Carrying amount as at 31 December | – | 154,630 | 154,630 |
| Of which current (≤ 1 year) | – | 25,121 | 25,121 |
| Of which non-current (>1 year) | – | 129,509 | 129,509 |
| 2008 (in thousands of euros) | Investments held for trading | Investments classified as assets measured at fair value through profit or loss | Total |
| Carrying amount as at 1 January | – | – | – |
| Purchases | 8,852 | 25,652 | 34,504 |
| Sales | -3,269 | – | -3,269 |
| Movements in fair value | – | 1,241 | 1,241 |
| Carrying amount as at 31 December | 5,583 | 26,893 | 32,476 |
| Of which current (≤ 1year) | 5,583 | – | 5,583 |
| Of which non-current (>1 year) | – | 26,893 | 26,893 |
Note 48 contains details of the way in which the fair value is measured.
19. Available-for-sale investments
This item includes bonds issued by public authorities and others at fixed or variable interest, other fixed-income securities and shares. The unlisted shares relate mainly to strategic interests in securities and clearing organisations for which no reliable financial information is available that can be used to calculate the fair value at year -end.
In 2009, impairment losses totalling €0.2 million (2008: €32.9 million) were recognised on shares and interestbearing securities in the available-for-sale investments portfolio. See note 10 for a further explanation of these items.
| (in thousands of euros) | 31-12-2009 | 31-12-2008 |
| Securities lodged as collateral were employed as follows: Securities lending | 165,864 | 121,145 |
Movements in available-for-sale investments were as follows:
| 2009 (in thousands of euros) |
Money market instruments | Bonds | Shares | Total |
| Carrying amount as at 1 January | 99,595 | 555,273 | 27,572 | 682,440 |
| Purchases | 408,650 | 820,152 | 6,610 | 1,235,412 |
| Sales | -119,000 | -193,271 | -12,790 | -325,061 |
| Movements in fair value | -1,592 | 29,771 | 6,676 | 34,855 |
| Redemptions | -147,653 | -190,483 | – | -338,136 |
| Impairment losses | – | 130 | -370 | -240 |
| Carrying amount as at 31 December | 240,000 | 1,021,572 | 27,698 | 1,289,270 |
| Of which current (≤ 1 year) | 240,000 | 308,636 | 27,698 | 576,334 |
| Of which non-current (>1 year) | – | 712,936 | – | 712,936 |
| 2008 (in thousands of euros) | Money market instruments | Bonds | Shares | Total |
| Carrying amount as at 1 January | 425,027 | 901,876 | 42,421 | 1,369,324 |
| Purchases | 1,103,066 | 360,943 | 10,431 | 1,474,440 |
| Sales | – | -96,670 | -506 | -97,176 |
| Movements in fair value | -1,159 | -4,960 | -13,799 | -19,918 |
| Redemptions | -1,427,339 | -584,001 | – | -2,011,340 |
| Impairment losses | – | -21,915 | -10,975 | -32,890 |
| Carrying amount as at 31 December | 99,595 | 555,273 | 27,572 | 682,440 |
| Of which current (≤1 year) | 99,595 | 195,756 | 27,572 | 322,923 |
| Of which non-current (>1 year) | – | 359,517 | – | 359,517 |
Note 48 contains details of the way in which the fair value is measured.
20. Business combinations
Acquisition of German subsidiary
On 16 July 2009, KAS BANK acquired a 100% interest in Deutsche Postbank Privat Investment Kapitalanlagegesellschaft mbH (PPI) for €15.0 million. The acquired business was included in the KAS BANK consolidation from 1 August 2009 onwards. On 23 November 2009, PPI became operationally and legally fully integrated as part of KAS BANK’s subsidiary KAS Investment Servicing GmbH. This acquisition strengthens
KAS BANK’s independent position as a’pure player‘ on the German market for securities services and investment administration.
The effect of the acquisition on the assets and liabilities of KAS BANK is presented below. The carrying amounts are those measured in accordance with the applicable IFRS standards immediately prior to the acquisition.
| (in thousands of euros) | Carrying amount as at 1 August 2009 | Fair value adjustment | Fair value as at 1 August 2009 |
| Banks | 11,809 | – | 11,809 |
| Loans and advances | 104 | – | 104 |
| Intangible assets | – | 4,220 | 4,220 |
| Deferred tax liabilities | – | -1,318 | -1,318 |
| Employee benefits | -82 | – | -82 |
| Prepayments/accruals etc. net | -238 | – | -238 |
| Net identifiable assets and liabilities | 11,593 | 2,902 | 14,495 |
| Goodwill | 537 | ||
| Total cost of acquisition | 15,032 |
The fair value of the assets and liabilities was measured as at the acquisition date. The estimated fair value of the customer base, amounting to €4.2 million, was arrived at using a discount rate of 26.5% (after tax), reflecting the expected internal return on the investment made, taking account of the synergistic gains resulting from the integration of PPI in KAS Investment Servicing GmbH.
In 2009, KAS BANK incurred costs relating to the acquisition totalling €0.5 million in respect of professional advice and legal services. These costs have been included in the cost of acquisition.
The goodwill recognised in relation to the acquisition is mainly attributable to:
| • |
avoidance of the start-up costs otherwise incurred by KAS BANK if it had had to recruit staff independently in order to service PPI clients; |
| • |
the return on the minimum equity to be maintained by PPI in order to satisfy solvency standards; and |
| • |
the difference between the fair value and the face value (carrying amount) of the deferred tax liability. |
For further information on the goodwill, reference is made to note 25. The recognised goodwill is not expected to be deductible for tax purposes. The revenue and results achieved in the first seven months of 2009 are not representative of the revenues and results for the full year, following acquisition. On the basis of the projections for 2010, the management expects annual revenue and full year’s result to be €5.7 million and €1.6 million positive, respectively. The result for the period between acquisition date and the date of the merger with
KAS Investment Servicing GmbH was €0.8 million positive.
21. Current tax assets and liabilities
| (in thousands of euros) | 31-12-2009 | 31-12-2008 |
| Current tax assets | 25,447 | 35,570 |
| Current tax liabilities | -1,354 | -1,297 |
| Net tax liabilities/assets | 24,093 | 34,273 |
| Carrying amount as at 1 January | 34,273 | 7,298 |
| Settled with tax authority | -3,418 | 9,286 |
| Tax payable for year | -7,430 | 12,902 |
| Changes in deferred tax liabilities relating to revaluation reserve | -1,286 | 1,590 |
| Dividend tax assets in respect of prior years | 1,242 | 3,636 |
| Other | 712 | -439 |
| Carrying amount as at 31 December | 24,093 | 34,273 |
22. Otherassets
These are assets which cannot be classed with any of the other balance sheet items, including amounts outgoing for account of clients which have not yet been processed.
23. Prepayments and accrued income
This item includes prepaid expenses which relate to a subsequent period or periods, sums invoiced but not yet received and accrued interest.
24. Property and equipment
The fair value of the premises represents the fair value arrived at by the appraiser at year-end 2009, based on continued use. The remaining useful life of the buildings, put at 30 years by the appraiser in 2007, has not been revised. Installations not integral to the buildings have been disregarded for the purposes of valuation. The value of the land has been based on the gross floor area related to the area of the site, applying market prices.
| (in thousands of euros) | 31-12-2009 | 31-12-2008 |
| Land and buildings in use by the company | ||
| Carrying amount as at 1 January | 40,735 | 41,527 |
| Depreciation for year | -792 | -792 |
| Fair value adjustment on revaluation | -5,691 | – |
| Effect of revaluation on accumulated depreciation | 1,473 | – |
| Fair value | 53,470 | 59,161 |
| Accumulated depreciation | -17,745 | -18,426 |
| Carrying amount as at 31 December | 35,725 | 40,735 |
| (in thousands of euros) | Hardware | Furniture | Technical installations | Total 2009 | Total 2008 |
| Other property and equipment | |||||
| Carrying amount as at 1 January | 1,716 | 653 | 7,586 | 9,955 | 9,912 |
| Investments | -21 | 76 | 1,149 | 1,204 | 2,494 |
| Investments through business combinations | – | – | – | – | 191 |
| Depreciation for year | -834 | -204 | -1,784 | -2,822 | -2,642 |
| Cost | 2,863 | 1,226 | 16,989 | 21,078 | 33,225 |
| Accumulated depreciation | -2,002 | -701 | -10,038 | -12,741 | -20,068 |
| Accumulated impairments | – | – | – | – | -3,202 |
| Carrying amount as at 31 December | 861 | 525 | 6,951 | 8,337 | 9,955 |
| Total property and equipment | 44,062 | 50,690 |
The carrying amount of the buildings and land, calculated using the cost method, is €16.7 million (2008: €16.8 million).
Finance leases
KAS BANK leases part of the hardware under a number of finance lease contracts. KAS BANK has the option of purchasing the hardware upon expiry of the lease contract at a predetermined price. The carrying amounts of the leased hardware as at year -end 2009 amounted to nil (2008: €0.2 million).
25. Intangible assets
This item includes the costs of software developed in-house and software purchased from third parties, goodwill paid in connection with acquisitions and the value of acquired customer bases and licences (other intangible assets). Movements in this balance sheet item were as follows:
| (in thousands of euros) | Goodwill | Purchased software | In-house software | Other intangible assets | Total 2009 | Total 2008 |
| Carrying amount as at 1 January | 5,250 | 3,417 | 4,827 | 3,700 | 17,194 | 6,744 |
| Investments | – | 2,302 | 1,256 | – | 3,558 | 5,253 |
| Investments through business combinations | 537 | – | – | 4,220 | 4,757 | 14,899 |
| Amortisation for year | – | -2,538 | -1,353 | -616 | -4,507 | -4,468 |
| Impairment losses | – | – | – | – | – | -5,234 |
| Cost | 11,021 | 12,983 | 7,392 | 8,068 | 39,464 | 36,877 |
| Accumulated amortisation | – | -9,802 | -2,662 | -764 | -13,228 | -14,449 |
| Accumulated impairments | -5,234 | -5,234 | -5,234 | |||
| Carrying amount as at 31 December | 5,787 | 3,181 | 4,730 | 7,304 | 21,002 | 17,194 |
The goodwill and other intangible assets accounted for in the above table relate to KAS Investment Servicing GmbH (acquired in 2008) and Deutsche Postbank Privat Investment Kapitalanlagegesellschaft mbH (acquired in 2009). The latter entity has been operationally and legally fully integrated into KAS BANK’s subsidiary KAS Investment Servicing GmbH, creating a single cash-generating unit. The recoverable amount of this cashgenerating unit has been calculated on the basis of the value in use, which was arrived at in conjunction with outside experts. The recoverable amount exceeds the carrying amount and no impairment needs to be recognised. The value in use was measured on the basis of the discounted expected future cash flows from continuing use of the unit, employing the following main assumptions:
| • |
The 2010-2015 Business Plan projects an annual rate of growth varying from 0% to 25% (average 11%), reflecting expected market growth. |
| • |
The period covered by the 2010-2015 Business Plan was chosen such that the cash flows from the expiring contract with Deutsche Postbank were not included in the calculation of the residual value. |
| • |
In calculating the net present value of the expected cash flows, a discount rate of 12% (after tax) was used (2008: 15%), this figure being based on the interest rate on 10-year bonds (at the time of the acquisition) plus a markup for a minimum return. |
Reasonable alternative assumptions would have the following impact on the value in use (ceteris paribus):
| • |
a decrease in the growth rate by 10 percentage points would produce a value in use €7.2 million lower; |
| • |
an increase of one percentage point in the discount rate would produce a value in use €2.7 million lower. Given a combination of these two scenarios, the value in use would turn out €9.0 million lower. This would not lead to the recognition of an impairment. |
26. Deferred tax assets and liabilities
Deferred tax assets are recognised in the balance sheet if it is probable that they will be set off against future profits.
| (in thousands of euros) | 31-12-2009 | 31-12-2008 |
| Deferred tax assets | 3,840 | 2,897 |
| Deferred tax liabilities | -13,097 | -9,856 |
| Net | -9,257 | -6,959 |
Movements in deferred tax assets and liabilities:
| (in thousands of euros) | 1-1-2009 | Changes recognised in income | Changes recognised in equity | Business combinations | 31-12-2009 |
| Pension obligation | 486 | -811 | 987 | – | 662 |
| Available-for-sale investments | -1,339 | -31 | -3,269 | – | -4,639 |
| Differences between reporting and tax bases: | |||||
| – Other property and equipment | 1,863 | -48 | – | – | 1,815 |
| – Buildings in use by the company | -6,085 | – | 1,222 | – | -4,863 |
| – In-house software | -1,231 | 107 | – | – | -1,124 |
| – Intangible assets | -1,201 | 238 | – | -1,318 | -2,281 |
| Tax loss carryforwards 1 | 477 | 625 | – | – | 1,102 |
| Other | 71 | – | – | – | 71 |
| Total | -6,959 | 80 | -1,060 | -1,318 | -9,257 |
| (in thousands of euros) | 1-1-2008 | Changes recognised in income | Changes recognised in equity | Business combinations | 31-12-2008 |
| Pension obligation | 1.474 | -907 | -81 | – | 486 |
| Available-for-sale investments | -180 | -35 | -1.124 | – | -1.339 |
| Differences between reporting and tax bases: | |||||
| – Other property and equipment | 1.579 | 284 | – | – | 1.863 |
| – Buildings in use by the company | -6.194 | – | 109 | – | -6.085 |
| – In-house software | -564 | -667 | – | – | -1.231 |
| – Intangible assets | – | – | – | -1.201 | -1.201 |
| Tax loss carryforwards 1 | – | 477 | – | – | 477 |
| Other | 175 | -104 | – | – | 71 |
| Total | -3.710 | -952 | -1.096 | -1.201 | -6.959 |
1 An amount of €0.1 million of the tax loss carryforwards expires in 2017 and 2018, the remaining losses being available indefinitely. KAS BANK expects the subsidiaries concerned to have become sufficiently profitable to be able to utilise the tax loss carryforwards before they expire.
EQUITY AND LIABILITIES
27. Banks
This item comprises non-subordinated liabilities to credit institutions other than amounts in the form of debt securities.
| 31-12-2009 | 31-12-2008 | |
| Due on demand by other credit institutions | 2,251,670 | 1,198,965 |
| Not due on demand by other credit institutions – current (29 1 year) | 76,681 | 18,166 |
| Total | 2,328,351 | 1,217,131 |
28. Funds entrusted
This item comprises all non-subordinated liabilities other than amounts owed to credit institutions and amounts in the form of debt securities.
| (in thousands of euros) | 31-12-2009 | 31-12-2008 |
| Savings | 391,449 | 292,160 |
| Time deposits | 253,413 | 445,509 |
| Other funds entrusted | 3,004,204 | 4,786,359 |
| Total | 3,649,066 | 5,524,028 |
| Demand deposits | 3,004,204 | 5,096,959 |
| Non-demand deposits- current (29 1 year) | 644,804 | 427,069 |
| Non-demand deposits- non-current (>1 year) | 58 | – |
| Total | 3,649,066 | 5,524,028 |
29. Other liabilities
These are liabilities which cannot be classed with any of the other balance sheet items, including amounts received for account of clients which have not yet been processed.
Other liabilities include KAS BANK cumulative preference shares. Of the 12,500,000 preference shares of €1.00 nominal value, 25 have been issued and are registered in the name of Stichting Preferente Aandelen KAS BANK.
A right has been granted to Stichting Preferente Aandelen KAS BANK to subscribe for cumulative preference shares in the capital of the company up to a nominal amount corresponding to 50% of the nominal value of the capital in the form of ordinary shares in issue at the time of subscription for those shares.
30. Accruals and deferred income
This item includes amounts received in advance in respect of income attributable to a subsequent period or periods and payables such as accrued interest.
31. Provisions
| (in thousands of euros) | 31-12-2009 | 31-12-2008 |
| Balance as at 1 January | 906 | 1,000 |
| Recog n ised | – | 906 |
| Utilised | -159 | – |
| Released | -40 | -1,000 |
| Effect of changes in discount rate | – | – |
| Interest | 33 | – |
| Balance as at 31 December | 740 | 906 |
| Of which current (≤ 1 year) | 143 | 163 |
| Of which non-current (> 1 year) |
In 2007, KAS BANK vacated some leased premises and part of the building is sublet. Future expenses less future income are expected to produce a loss and a provision of €0.9 million, representing the net present value of the future rental obligations (less the expected income), was recognised in respect thereof in 2008. There was no change in this situation in 2009.
32. Employee benefits
The employee benefits include retirement benefit and disability benefit liabilities.
| (in thousands of euros) | 31-12-2009 | 31-12-2008 |
| Pension liability | 2,595 | 1,895 |
| Other long-term employee benefits | 1,219 | 1,160 |
| Total | 3,814 | 3,055 |
Pension liability
For members of the Managing Board and for the staff in Germany, KAS BANK has a defined contribution plan. For the remaining employees, there is a defined benefit plan.
The Dutch defined benefit plan, under which the pensionable age is 65, is a part final-pay and part average-pay plan. The final-pay plan applies up to an income of €46,500 per annum, with the average-pay plan applying above that amount. The accrual rates are 1.8% and 2%, respectively. Contributions are paid by the employee as long as the contribution rate is 10% or below. If it exceeds this percentage, half of the excess is paid by the company and half by employee, up to a maximum of 5%. If the contribution rate exceeds 20%, all of the excess over 20% is paid by the company. As from 1 July 2007, a transitional arrangement will apply whereby the employee’s contribution increases by one percentage point each year on 1 July, up to the maximum of 5%.
The UK pension plan, under which the pensionable age is 60, is predominantly a defined benefit plan. If the contributions under the plan do not reach a minimum level, they are supplemented by the company.
The liability recognised under this heading concerns the Dutch pension plan and is calculated using the projected unit credit method. The measurement of the carrying amount is based on the actuarial calculations performed by the actuary as at 31 December 2009. The actuarial gains and losses are largely accounted for by mortality table adjustments, the increased probability of indexation of the rights of those members with deferred pensions and already in receipt of pensions expected by the bank’s management, adjustments based on experience as a result of changes in the membership of the plan and the positive return on the plan assets.
The funding ratio of Stichting Pensioenfonds KAS BANK, based on the pension fund’s accounting policies, as at year-end 2009 was 102% (2008: 92%). At the beginning of 2009, the pension fund’s executive committee drew up a recovery plan because the funding ratio was then below the level of 105%. Additionally, the reinsurance contract was due to expire at the end of 2009. Under this contract, KAS BANK was committed to making an additional contribution to bring the funding ratio up to 105% (based on KAS BANK’s accounting policies) if the funding ratio, based on a discount rate of 4%, should be below 105% on expiry of the contract. The contractually required additional contribution at year-end 2009, amounting to €1.2 million, has been included in the plan assets.
The pension liability/obligation can be analysed as follows:
| (in thousands of euros) | 31-12-2009 | 31-12-2008 |
| Present value of benefit obligation | 143,119 | 129,040 |
| Fair value of plan assets | -140,524 | -127,145 |
| Total pension liability | 2,595 | 1,895 |
| Movements in the present value of the benefit obligation were as follows: | ||
| Balance as at 1 January | 129,040 | 146,129 |
| Current service cost | 3,308 | 4,384 |
| Interest cost on obligation | 7,294 | 7,630 |
| Benefits paid and disbursement costs | -5,587 | -4,673 |
| Employee contributions | 1,001 | 717 |
| Value transfers (disposal of private banking activities) | -476 | |
| Actuarial gains and losses | 8,063 | -24,671 |
| Balance of benefit obligation as at 31 December | 143,119 | 129,040 |
| Movements in the fair value of plan assets were as follows: | ||
| Balance as at 1 January | 127,145 | 140,349 |
| Expected return on plan assets | 7,944 | 7,796 |
| Employer contributions | 5,830 | 7,786 |
| Employee contributions | 1,001 | 717 |
| Value transfers (disposal of private banking activities) | – | -476 |
| Benefits paid and disbursement costs | -5,587 | -4,673 |
| Actuarial gains and losses | 4,191 | -24,354 |
| Balance plan assets as at 31 December | 140,524 | 127,145 |
| Pension costs comprise: | ||
| Current service cost | 3,308 | 4,384 |
| Interest cost on obligation | 7,294 | 7,630 |
| Expected return on plan assets | -7,944 | -7,796 |
| Net benefit expense | 2,658 | 4,218 |
Actuarial gains and losses are accounted for in equity. In 2009, an amount of €3.9 million was charged to equity (2008: €0.3 million added).
| (in thousands of euros) | 2009 | 2008 | ||
| The plan assets comprise: | ||||
| Shares | 43,537 | 31% | 32,981 | 26% |
| Bonds | 93,498 | 67% | 86,125 | 68% |
| Derivatives | -2,202 | -2% | 2,599 | 2% |
| Cash | 5,691 | 4% | 5,440 | 4% |
| Total | 140,524 | 1000/0 | 127,145 | 1000/0 |
The return on plan assets in 2009 amounted to €12.1 million positive (2008: €16.6 million negative). The expected return on plan assets is calculated by expressing the nominal interest on the bonds in the portfolio as a percentage of the market value of the portfolio (including accrued interest). To reflect the higher risk, the return on shares is assumed to be 4 percentage points higher than the bond return. The expected return is then weighted to reflect the ratio of shares to bonds.
| Historical information (in thousands of euros) |
2009 | 2008 | 2007 | 2006 | 2005 |
| The principal actuarial assumptions employed are: | |||||
| Discount rate | 5.60% | 5.60% | 5.30% | 4.60% | 4.20% |
| Return on plan assets | 5.95% | 6.07% | 5.50% | 5.50% | 5.25% |
| Average rate of pay increases‘ | 2.00% | 1.00% | 2.00% | 3.00% | 2.50% |
| 1 Excluding promotion-related increases | |||||
| Pension liability | |||||
| Present value of benefit obligation | 143,119 | 129,040 | 146,129 | 157,047 | 158,823 |
| Fair value of plan assets | -140,524 | -127,145 | -140,349 | -135,452 | -128,136 |
| Deficit | 2,595 | 1,895 | 5,780 | 21,595 | 30,687 |
| Experience adjustments | |||||
| Benefit obligation | |||||
| Adjustment of career table | 784 | 3,161 | -5,081 | -2,499 | 3,061 |
| Adjustment of assumption regarding increases for non-active members | -2,429 | 11,071 | – | – | – |
| Adjustment of life table | -4,344 | – | – | -5,202 | – |
| Adjustment of discount rate | – | 5,409 | 21,619 | 12,591 | -17,003 |
| Adjustment of disability rates | – | – | – | – | 1,827 |
| Adjustment of turnover table | 22 | 3,587 | – | 2,032 | – |
| Changes in plan membership | -2,096 | 1,443 | 2,175 | 1,988 | 2,461 |
| Actuarial gains/losses on benefit obligation | -8,063 | 24,671 | 18,713 | 8,910 | -9,654 |
| Plan assets | |||||
| Actual return on plan assets | 12,135 | -16,558 | 2,615 | 4,008 | 11,359 |
| Expected return on plan assets | 7,944 | 7,796 | 7,524 | 6,798 | 6,074 |
| Actuarial gains/losses on plan assets | 4,191 | -24,354 | -4,909 | -2,790 | 5,285 |
| Actuarial gains/losses recognised directly in equity | -3,872 | 317 | 13,804 | 6,120 | -4,369 |
The contributions to the defined benefit plan, including employee contributions, expected to be made in 2010 amount to €4.7 million (the expected level of contributions in 2009 was €5.3 million; the actual level of contributions in 2009 was €6.8 million (2008: €8.5 million)). The difference in 2009 between the expected and actual contributions was mainly due to the previously mentioned additional contribution of €1.2 million (2008: nil).
Other long-term employee benefits
Other long-term employee benefits represent the liabilities in respect of service anniversary bonuses and disability benefits. The applied assumptions are the same as those used in measuring the pension liability.
33. Share capital
| Ordinary shares of €1.00 nominal value | Number 2009 | Number 2008 |
| Shares | 25,000,000 | 25,000,000 |
| Shares in portfolio | 9,300,983 | 9,300,983 |
| Issued share capital | 15,699,017 | 15,699,017 |
The authorised capital is €25 million. Of the shares in issue, 15,616,019 (2008: 15,613,737) shares are registered in the name of Stichting Administratiekantoor Aandelen KAS BANK, which has issued bearer depositary receipts for them, likewise in denominations of €1.00. Most of the remaining 82,998 (2008: 85,280) ordinary shares are held by Admitted Institutions of NYSE Euronext Amsterdam N.V.
Capital management
KAS BANK’s policy is aimed at maintaining a strong capital base in order to meet the bank’s existing and future capital requirements and to satisfy the external capital adequacy standards at all times. The Managing Board monitors capital adequacy on the basis of the BIS capital ratio, which is calculated by comparing the riskweighted assets and off-balance-sheet items with actual own funds. Own funds comprise core capital (Tier 1 capital) plus supplementary capital (Tier 2 capital). The ratio is reported to the Managing Board and De Nederlandsche Bank N.V., as regulator, each month. KAS BANK’s internal standard is a minimum figure of 12.5%. The BIS capital ratio to be maintained by law is at least 8%.
In addition, the amount of actual own funds is tested on a regular basis against a model specifically tailored to KAS BANK’s risk profile, using the Internal Capital Adequacy Assessment Process stipulated by the banking reg u lator.
The new Basel II capital adequacy requirements effective as from the beginning of 2008 mean, amongst other things, tougher standards for the capital required to match securities lending and the introduction of capital adequacy standards matching operating risks. With the decline in securities lending activities since the end of 2008, owing to market developments, combined with increased collateral requirements imposed by KAS BANK, the tougher securities lending standards have so far had only a limited effect on the required minimum capital.
| Capital ratios | 2009 | 2008 |
| Tier 1, based on Basel II as at year-end | 21 | 15 |
| BIS ratio based on Basel II as at year-end | 24 | 18 |
| BIS ratio based on Basel II average for the year | 21 | 15 |
The capital composition bandwidths are set out in the Balance Sheet Management Guidelines and approved by both the Managing Board and the Supervisory Board. Movements in both the capital and the risk -weighted balance sheet and off -balance-sheet items are addressed on a monthly basis by the Asset & Liability Committee. If warranted, changes in the required minimum capital are reported more frequently either generally or for specific asset classes. Management of the required minimum capital mainly involves changes in the Treasury investment policy, changes in collateral requirements and decisions concerning acceptance policy with regard to different categories of client and credit product. The existing amount of equity/actual own funds and any action on this front that is required are reviewed on a quarterly basis by the Asset & Liability Committee.
At the same time, constant attention is given to balancing the benefits of a strong capital base with the higher yield potential inherent in a narrower capital base. The Managing Board aims to achieve an average return on equity of 5-8 percentage points above the 10-year government bond yield. The average return on equity in 2009 was 13.7% (11.8% based on operating result) and, in 2008, -20.2% (8.7% based on operating result). In assessing the profitability of the various KAS BANK activities, the return on risk-allocated capital plays an important part.
34. Treasury shares
Each year, KAS BANK awards conditional stock options to the members of the Managing Board and to other staff and awards condition al shares to the members of the Managing Board. Further details of this share and stock option plan are contained in the note on share-based payments. As at 31 December 2009, there were 1,343,021 (2008: 1,094,654) options outstanding in the hands of existi ng and former members of the Managing Board and other staff, of which 1,043,785 (2008: 952,724) were conditional. In addition, as at 31 December 2009, there were 39,157 (2008: 18,619) shares outstanding in the hands of existing and former members of the Managing Board, of which 36,642 (2008: 18,619) were conditional.
It is KAS BANK policy to cover the obligations arising from the grant of these options by repurchasing shares. In this connection, shares were purchased at an average price of €22.58 (2008: €22.58) (FIFO method). The nominal value of the repurchased shares totalled €1,125,579 (2008: € 1,125,579).
Movements in the numbers of shares repurchased to cover the options granted and shortly to be granted, together with the associated average purchase prices, were as follows:
| Number 2009 | Number 2008 | |
| Opening balance at €22.58 (2008: €20.17) | 1,125,579 | 727,448 |
| Purchased (2008 at €24.82) | – | 485,397 |
| Sold (2008 at €15.35) | – | -87,266 |
| Closing balance at €22.58 (2008: C 22.58) | 1,125,579 | 1,125,579 |
35. Share premium
Of the share premium, €19.6 million (2008: €19.6 million) may be distributed free of tax. The share premium reserve is formed by payments from shareholders in excess of the nominal value of shares.
36. Revaluation reserve
| (in thousands of euros) | 31-12-2009 | 31-12-2008 |
| The revaluation reserve is analysed as follows: | ||
| Revaluation reserve for land and buildings in use by the company | 14,210 | 17,778 |
| Revaluation reserve for available-for-sale investments | 13,478 | 2,159 |
| Balance as at 31 December | 27,688 | 19,937 |
Revaluation reserve for land and buildings in use by the company
This reserve comprises the accumulated net changes in the fair value of properties owned by KAS BANK.
| (in thousands of euros) | 2009 | 2008 |
| Movements in this item were as follows: | ||
| Balance as at 1 January | 17,778 | 18,096 |
| Revaluation of land and buildings in use by the company | -4,218 | – |
| Transferred to other reserves | -426 | -318 |
| Transferred from deferred tax liabilities | 1,222 | 109 |
| Transferred to current tax assets | -146 | -109 |
| Balance as at 31 December | 14,210 | 17,778 |
Revaluation reserve for available-for-sale investments
This reserve comprises the accumulated net changes in the fair values of available-for-sale investments.
| (in thousands of euros) | 2009 | 2008 |
| Movements in this item were as follows: | ||
| Balance as at 1 January | 2,159 | 794 |
| Gains and losses on available-for-sale investments | 23,826 | -31,168 |
| Gains and losses on available-for-sale investments transferred to income | -8,191 | -932 |
| Impairment losses | 93 | 32,890 |
| Transferred to/from deferred tax assets and liabilities | -3,269 | -1,124 |
| Transferred to/from current tax assets | -1,140 | 1,699 |
| Balance as at 31 December | 13,478 | 2,159 |
The revaluation reserve for available-for-sale investments includes an amount of €1.3 million negative (2008: €1.5 million negative) in respect of exchange differences on shares in the investment portfolio.
37. Other reserves
| (in thousands of euros) | 2009 | 2008 |
| Movements in this item were as follows: | ||
| Balance as at 1 January | 175,653 | 169,582 |
| Profit appropriation for previous year | -39,933 | 10,118 |
| Result on the sale of own shares repurchased | – | 1,862 |
| Share-based payments | 796 | 647 |
| Actuarial gains and losse s on pensions | -3,872 | 317 |
| Adjustment of deferred tax liabilities | 987 | -81 |
| Transferred from revaluation reserve | 426 | 318 |
| Interim dividend | – | -7,065 |
| Other movements | – | -45 |
| Balance as at 31 December | 134,057 | 175,653 |
38. Unappropriated result
| 31-12-2009 | 31-12-2008 | |
| Result for the period | 24,581 | -39,933 |
| Interim dividend | -4,809 | – |
| Balance as at 31 December | 19,772 | -39,933 |
Based on the results achieved in the first half of 2009, an interim dividend of €4.8 million, equating to €0.33 per ordinary share (2008: €0.45) was declared. The General Meeting of Shareholders will be invited to declare a final dividend for 2009 of €0.40 per ordinary share. If this resolution is passed, the total remaining amount of the final dividend will be €5.8 million.
Notes on off-balance-sheet commitments and contingent liabilities
39. Contingent liabilities
Guarantees
This includes all transactions in which the bank has guaranteed the liabilities of third parties. Guarantees have been given on behalf of clients in relation to the bank’s direct connections to foreign stock exchanges.
In addition to the guarantees disclosed below the balance sheet, there are non -quantified guarantees vis-ˆ-vis Equens Nederland, NASDAQ Dubai Ltd., European Multilateral Clearing Facility N.V., LCH Clearnet SA, Eurex Clearing AG, LCH Clearnet Ltd., SIS X-Clear AG, European Central Counterparty Limited, CCP Austria Abwicklungsstelle für Börsengeschäfte GmbH and Intesa San Paolo S.P.A.
KAS BANK is covered by the Nederlandsche Bank’s deposit guarantee system.
40. Irrevocable facilities
Irrevocable facilities mainly comprise credit lines which have been irrevocably agreed for corporate clients but not yet drawn upon. In the case of the majority of the irrevocable credit lines, some form of the collateral security or counter-guarantee has been provided.
41. Operating lease commitments and long -term rental and maintenance contracts
| (in thousands of euros) | 31-12-2009 | 31-12-2008 |
| The commitments fall due as follows: | ||
| Up to one year | 3,440 | 3,178 |
| Between one and five years | 5,653 | 3,757 |
| Total | 9,093 | 6,935 |
The operating lease commitments and long-term rental and maintenance contracts mainly relate to computer hardware, software, motor vehicles and office premises. The contracts are not subject to indexation of lease instalments or rentals. Expenses totalling €6.8 million (2008: €6.2 million) relating to these contracts have been included in the income statement under the heading of other administrative expenses.
The future charges in connection with rented premises in Amsterdam that have been vacated by the company have been recognised under the heading of a provision for a loss-making contract (see also note 31).
Risk management
42. Risk management
Most significant risk-related developments in 2009
The financial crisis in 2008 had an impact on KAS BANK and not all our risk management measures proved adequate. Efforts in 2009 therefore focused on tightening up risk management and steps have been taken to enhance the quality of the risk management measures where necessary. At the end of 2008, a bank-wide programme was launched under the banner of ‚KAS BANK Risk Management‘, involving the following actions in 2009:
| • |
critical examination of the risks and the internal control measures concerned with each of the primary and secondary processes against a background of unusual market circumstances; |
| • |
tightening-up of the control organisation at KAS BANK and in particular within the IT organisation; |
| • |
critical examination of liquidity policy, leading to the preparation and implementation of a new Liquidity Contingency Plan; |
| • |
establishment of new requirements for collateral management and the securities lending activities; |
| • |
further refinement of intraday risk management — an effort which will continue with the same vigour in 2010; |
| • |
reorganisation of contract management; |
| • |
scrutiny of the risk governance structure, leading to the preparation of a new version of the risk charter and the formal adoption of a clear constitution for all parts of the risk management framework; |
| • |
rationalisation of the internal account structure along with implementation of the most appropriate reconciliation methods; |
| • |
identification of staffing weaknesses and action on training and appointment of staff of the right calibre to critical posts; |
| • |
preparation and implementation of a policy plan by a risk awareness working group; |
| • |
conduct of a large number of Risk Culture Self-Assessments within the organisation, which have led to various improvements. |
In addition, the Managing Board adopted as formal policy in 2009 that KAS BANK’s attitude to risk was one of low acceptance and this stance was endorsed by the Supervisory Board. Also in 2009, the Risk Management organisation was strengthened by the creation of the position of Chief Risk Officer and the appointment of someone to that post. The Risk Management Department was also reorganised to reflect the principal of categories of risk to which KAS BANK is exposed, with the appointment of dedicated risk managers for credit risk, operating risk and treasury operations and the establishment of separate Operating Risk, Market Risk and Credit Risk business units. Operating risk policy was expanded and updated and the new policy was formally adopted, with KAS BANK employing a network of risk coordinators linked to the fifty and more processes into which the bank’s activities are divided, once again emphasising, among other things, that risk management is the responsibility of each and every employee in the first instance. To support the entire organisation in its approach to operating risk management at individual level, a risk support centre was set up within the Risk Management Department in 2009 to support and follow up the activities in the line organisation aimed at identifying and mitigating risks.
KAS BANK’s risk management framework
Risk appetite
KAS BANK has a low acceptance of risk. This was again explicitly reaffirmed by the Board of Management in 2009 and endorsed by the Supervisory Board. There are three components to the management framework for the acceptance of risk:
| • |
careful selection of the mix of activities and the way in which the company is managed; |
| • |
specific risk management activities, as described below; |
| • |
capitalisation policy. |
With regard to the variables used to guide management decisions, there is careful scrutiny to ensure that the key performance indicators used are commensurate with a low risk profile. The remuneration policy has been reviewed by the Risk Management Department to identify elements that might have the effect of increasing the appetite for risk.
Structure
KAS BANK’s risk management framework is structured around three lines of defence. These are designed to ensure that risks are managed within the framework of risk objectives defined by the Managing Board. The allocation of responsibility for risk management is structured accordingly, with the Managing Board bearing ultimate responsibility for the organisation and oversight of the risk management framework. The operating departments form the first line of defence; these departments have primary responsibility for managing day-today risks in their operating processes. The main parties in the second line of defence are the Risk Management, Compliance, Legal and Finance departments and various committees. These committees have special responsibility for risk analysis, policy preparation and coordination of efforts to control the bank’s risks, with a remit that generally extends across the entire bank. It is the responsibility of the Chief Risk Officer to formulate risk policy with regard to the objectives set by the Managing Board. This policy is used as the basis for setting a series of limits and guidelines on managing market, liquidity, credit, operating and compliance risks throughout the bank. The Chief Risk Officer reports directly to the Managing Board. The third line of defence comprises the Internal Audit Department, which conducts operating, IT, compliance and financial audits as a means of independently and objectively assessing the effectiveness of internal controls.
The bank has established various committees for risk management purposes, and these also form part of the second line of defence. These committees operate within the mandate granted by the Managing Board, with the latter remaining ultimately responsible for structuring and supervising the overall risk management framework.
| • |
The Risk Management Committee is responsible for devising and monitoring the bank’s risk management policy. The committee has set procedures, guidelines and limits for market, liquidity, credit and operational risks. The members of the Managing Board and the Chief Risk Officer form the permanent core of the Risk Management Committee. The heads of the divisions and corporate staff departments may be co-opted onto the committee as weII. The Risk Management Committee meets every two weeks. The main providers of information to the Risk Management Committee are the Chief Risk Officer, the Treasury Risk Management Committee and the Internal Audit Department. |
| • |
The Asset & Liability Committee advises the Risk Management Committee concerning market risk policy, ensures that agreed proposals are implemented and approves proposals for purchases and sales of securities in the bank’s portfolios. The Asset & Liability Committee comprises the members of the Managing Board, the Head of Treasury, the Controller and the Chief Risk Officer and meets once a month. The main provider of information is the Chief Risk Officer. |
| • |
The Treasury Risk Management Committee meets every two weeks to discuss the risks involved in treasury activities. The Treasury Risk Management Committee is made up of the management of the Treasury Department and Treasury back-office staff and the Head of Credit Risk Management. The main providers of information to the Treasury Risk Management Committee are the Head of Credit Risk Management and the Treasury back office. |
At a Supervisory Board level, the Audit Committee and the Risk Management Supervision Committee monitor the Managing Board’s compliance with KAS BANK’s risk management policy and procedures. The Risk Management Supervision Committee focuses on aspects of internal risk management and control systems within KAS BANK from a banking operations perspective. This includes credit, liquidity and market risks. The Audit Committee focuses on aspects of internal risk management and control systems within the bank from an accounting perspective, including operational and compliance risks.
Meetings of the Audit Committee are attended by a delegation from the Managing Board, the Controller and the internal auditor and also generally by the external auditors. Meetings of the Risk Management Supervision Committee are attended by a delegation from the Managing Board and the Chief Risk Officer.
Types of risks faced by KAS BANK
By virtue of its business activities and its use of financial instruments, the main risks to which KAS BANK is exposed are as follows:
| • |
Market risk: the risk that the fair value of a financial instrument will fluctuate as a result of changes in market variables. In the case of KAS BANK these relate to changes in the prices of securities, the value of foreign currencies and movements in interest rates. |
| • |
Liquidity risk: the risk that the bank will be unable to meet its financial obligations on time. |
| • |
Credit risk: the risk of financial losses if a counterparty to a financial instrument defaults on its contractual obligations. |
| • |
Operational risk: the risk that losses will occur as a result of weaknesses or failures in internal processes and/or systems, human frailties or outside events. These risks include operational risks such as IT problems, poor organisational structure, absent or inadequate internal controls, human error, fraud and externalthreats. |
| • |
Compliance risk: the risk that KAS BANK’s reputation will be damaged by failure to comply with applicable legislation and regulations or internal policies and procedures. Failure by KAS BANK to manage the compliance risk effectively may also have other consequences in the form of administrative and other penalties, sanctions and, in the extreme case, suspension or withdrawal of licences and permits. |
This part of the notes contains information on KAS BANK’s exposure to each of the above risks and KAS BANK’s objectives, basic approaches and procedures for managing and measuring these risks. These financial statements also include more detailed quantified notes.
43. Market risk
General
Market risk concerns the risk of the value of a financial instrument changing as a result of changes in market variables. In the case of KAS BANK these relate to changes in the prices of securities, the value of foreign currencies and movements in interest rates. Market risk arises in respect of positions held for our own account and risk and concerns trading positions held in order to benefit from short-term movements in prices and nontrading positions held for the longer term or until maturity.
Managing market risk
KAS BANK’s policy is designed to maintain a conservative approach to exposure to market risks such as interest rate and currency risks. The bank’s Risk Management Committee has adopted procedures and guidelines and set limits with regard to market risks. The Asset & Liability Committee and the Treasury Risk Management Committee monitor compliance with the market risk policy and procedures. Treasury is responsible for managing the treasury position in terms of cash and securities within the guidelines and limits established by the Risk Management Committee.
KAS BANK uses the value -at-risk (VaR) model to monitor the risks in its securities, foreign currency and derivatives positions. The VaR is defined as the maximum possible loss that is likely to occur, with a certain statistical level of confidence, in normal circumstances as a result of changing risk factors over a predetermined time horizon. In calculating the value at risk, KAS BANK employs the method of historical simulation based on weighted historical data over a period of approximately 18 months (using the ageing method), with a confidence level of 97.5% and a time horizon of one week. The Risk Management Committee has set a VaR limit of €1.5 million for the trading position. No VaR limit has been set for the non-trading position, but a VaR calculation is made for this portfolio. Risk Management monitors the VaR for the proprietary securities and derivatives position and submits a monthly report of the latest figures to the Asset & Liability Committee.
The system of using the VaR to measure risk does, however, have some limitations. The VaR quantifies the potential loss only on the assumption of normal market circumstances. In practice, however, this assumption is not always correct, specifically in extreme conditions. This could consequently result in the extent of potential losses being underestimated. The VaR calculation also makes use of historical data to predict the pattern of future price fluctuations. Future fluctuations may differ substantially from those observed in the past. On top of that, the use of a time horizon of one week assumes that all positions in the portfolio can be liquidated within one week, which may not hold good in periods of illiquidity or extreme events affecting the market. Using a confidence level of 97.5% also means the VaR takes no account of losses outside this level of confidence.
Market risk exposure
The table below shows VaR figures as internally reported:
| (in millions of euros) | Year-end | High | Low | Average | |
| Total VaR (no limit) | 2009 | 2.4 | 4.9 | 2.2 | 3.4 |
| Total VaR (no limit) | 2008 | 8.3 | 9.2 | 3.7 | 5.5 |
| VaR – trading portfolio (included in total VaR) | |||||
| (limit €1.5 million) | 2009 | 0.0 | 0.0 | 0.0 | 0.0 |
| (limit €1.5 million) | 2008 | 0.2 | 0.2 | 0.0 | 0.1 |
Other control measures concerned with market risk management involve limits on overnight proprietary positions in foreign currencies. The Treasury back office reports the actual foreign -currency proprietary overnight positions, compared with the limits set by the bank, to the Treasury Risk Management Committee on a weekly basis.
Currency risk
The currency risk concerns the risk that the fair value of future cash flows from a financial instrument will fluctuate as a result of changes in exchange rates. The following table presents the year-end amounts outstanding in foreign currencies:
| 31 December 2009 In thousands of euros | Assets | Liabilities | Net | Derivatives | Open (abs.) |
| USD | 100,938 | 386,700 | -285,762 | 285,870 | 108 |
| GBP | 148,651 | 174,565 | -25,914 | 29,611 | 3,697 |
| CHF | 35,362 | 43,947 | -8,585 | 8,601 | 16 |
| SEK | 69,682 | 79,811 | -10,129 | 9,023 | -1,106 |
| JPY | 34,105 | 37,253 | -3,148 | 3 | -3,145 |
| AUD | 8,260 | 20,550 | -12,290 | 15,323 | 3,033 |
| CAD | 4,073 | 12,440 | -8,367 | 8,975 | 608 |
| Other | 42,551 | 42,929 | -378 | 1,499 | 1,121 |
| Total | 443,622 | 798,195 | -354,573 | 358,905 |
| 31 December 2008 In thousands of euros | Assets | Liabilities | Net | Derivatives | Open (abs.) |
| USD | 342,948 | 426,930 | -83,982 | 83,924 | -58 |
| GBP | 210,578 | 331,972 | -121,394 | 127,269 | 5,875 |
| CHF | 207,432 | 191,655 | 15,777 | -14,518 | 1,259 |
| SEK | 89,992 | 93,891 | -3,899 | 3,991 | 92 |
| JPY | 42,162 | 86,195 | -44,033 | 39,854 | -4,179 |
| AUD | 25,367 | 17,096 | 8,271 | -5,828 | 2,443 |
| CAD | 12,070 | 10,226 | 1,844 | -1,367 | 477 |
| Other | 42,746 | 50,475 | -7,729 | 10,186 | 2,457 |
| Total | 973,295 | 1,208,440 | -235,145 | 243,511 |
A large proportion of the forward exchange transactions outstanding relates to the hedging of foreign exchange positions in the balance sheet, while the other forward foreign exchange transactions relate to trading positions.
The effect of a rise of 1% in the value of a foreign currency at the balance sheet date would result in an equivalent increase/decrease in pre-tax income, depending on whether the particular position was a net asset or liability. Conversely any similar weakening of the foreign currency would have the opposite effect.
Interest rate risk
The interest rate risk concerns the risk that the fair value of future cash flows from a financial instrument will fluctuate as a result of changes in market interest rates.
The interest rate risk present in ordinary banking operations is small, as interest rate terms are essentially variable. The main interest rate risks relate to the AFS (available-for-sale) portfolio and are monitored using VaR calculations.
The basic principles on which the bank’s interest rate risks are managed are detailed in the balance sheet management guidelines and approved by the Risk Management Committee. Monitoring of the interest rate risk employs an interest rate risk model, which is used for scenario analyses, stress-testing scenarios and Monte Carlo simulations. The Chief Risk Officer reports the results of the analyses to the Asset & Liability Committee on a quarterly basis.
A gradual increase of 200 basis points in the market interest rate for each maturity band from balance sheet date onward s would lead to a 17% decrease (2008: 3% decrease) in net interest income over a full year and a decrease in the market interest rate of 200 basis points would lead to an 14% decrease (2008: 6% decrease) in net interest income over a full year.
A sudden increase of 200 basis points in the market interest rate would result in a 4% (2008: 12%) decrease in shareholders‘ equity, while a sudden decrease of 200 basis points in the market interest rate would result in a 3% (2008: 13%) rise in shareholders‘ equity. These calculations assume that all financial instruments in the balance sheet as at balance sheet date are held until maturity and, if they mature within one year, are replaced by identical financial instruments.
KAS BANK’s fair value hedges comprise interest rate swaps used to hedge the interest rate risk on part of the AFS portfolio. Of the hedged positions, €590.5 million (2008: €38.5 million) relates to bonds with a fixed redemption date. In 2008 a perpetual bond of €5.0 million with a fixed coupon was hedged until the interest review date. The hedges take the form of interest rate swaps and relate to the interest rate risk incurred during the fixed-interest period.
Movements in the fair value of the interest rate derivatives used to hedge fair values are shown in ‚Interest‘ under the same heading as movements in the fair value of hedged positions.
44. Liquidity risk
General
The liquidity risk concerns the risk that the bank will be unable to meet its financial obligations on time. The basic approach to managing the liquidity risk is to ensure that adequate liquidity is available to meet our financial obligations in both normal and difficult circumstances.
Managing liquidity risk
The operating systems and departments notify Treasury on a daily basis of inward and outward flows of funds, financial assets and liabilities shortly falling due and requirements for collateral lodged with central banks and clearing institutions to facilitate settlement and payment processes on behalf of clients. Using this information, Treasury keeps a day-to-day watch on the bank’s liquidity position and ensures that sufficient collateral is held.
The Asset & Liability Committee advises the overarching Risk Management Committee on liquidity policy and monitors compliance. To back up the Liquidity Policy, a Liquidity Contingency Plan has been drawn up and adopted by the bank’s Asset & Liability Committee. A report on the liquidity position is submitted on a monthly basis to the Asset & Liability Committee and the Nederlandsche Bank.
Developments in 2009
The interbank money market dried up in 2008 and there was only limited recovery in 2009. In the year under review, however, KAS BANK continued to have access to ample liquidity by benefiting from maintaining the level of funds entrusted, from the more stringent liquidity policy and from shrinking the balance sheet. The liquidity surplus on a weekly and monthly basis, as reported to DNB, remained comfortably in excess of €1 billion throughout the year.
Liquidity risk exposure
The following maturity calendar shows that KAS BANK had a good liquidity position at the year-end, partly thanks to the highly liquid nature of its balance sheet. This good liquidity position is largely attributable to the stable balances maintained by clients at KAS BANK and meant that only limited recourse had to be sought to the interbank market. KAS BANK was consequently less affected by financial institutions‘ reduced willingness and ability to lend to each other. Finding a market for interbank deposits continues to be problematical, however. KAS BANK strives to ensure that it has sufficient access to credit lines in order to cover any temporary need for liquidity. We also hold large amounts of collateral at institutions such as the Dutch Central Bank and clearing institutions so that we can be sure of being able to settle client transactions properly even in the event of substantial rises in volumes.
The following maturity calendar shows the non-discounted cash flows from KAS BANK’s financial assets, liabilities and derivatives as at the contractual due dates.
| Maturity calendar as at 31 December 2009 (in thousands of euros) |
Direct | ≤ 3 months | ≤ 1 year | ≤ 5 years | >5 years | Total |
| Assets | ||||||
| Cash and deposits at the central bank | 469,340 | – | – | – | – | 469,340 |
| Banks | 2,318,904 | 388,522 | – | – | – | 2,707,426 |
| Loans and advances | 885,400 | 14,398 | – | – | 7,384 | 907,182 |
| Reverse repurchase agreements | – | 584,346 | – | – | – | 584,346 |
| Investments at fair value through profit or | ||||||
| loss | – | 1,094 | 28,679 | 64,736 | 85,760 | 180,269 |
| Available-for-sale investments | 271,384 | 59,406 | 275,408 | 633,763 | 130,925 | 1,370,886 |
| 3,945,028 | 1,047,766 | 304,087 | 698,499 | 224,069 | 6,219,449 | |
| Equity and liabilities | ||||||
| Banks | 2,251,670 | 76,681 | – | – | – | 2,328,351 |
| Funds entrusted | 3,004,204 | 643,634 | 1,170 | 58 | -3,649,066 | |
| 5,255,874 | 720,315 | 1,170 | 58 | – | 5,977,417 | |
| Derivatives | ||||||
| Foreign exchange contracts | ||||||
| • Incoming cash flow | – | 8,377,959 | 270,341 | 7,801 | – | 8,656,101 |
| • Outgoing cash flow | – | -8,375,664 | -270,160 | -7,802 | – | -8,653,626 |
| Interest contracts | ||||||
| • Incoming cash flow | – | 1,185 | 13,808 | 34,258 | 40,191 | 89,442 |
| • Outgoing cash flow | – | -9,686 | -16,948 | -46,040 | -43,710 | -116,384 |
| Share contracts | – | -338 | 20 | – | – | -318 |
| Credit contracts | – | – | – | – | – | – |
| – | -6,544 | -2,939 | -11,783 | -3,519 | -24,785 | |
| Contingent positions | ||||||
| Guarantees and irrevocable facilities | -93,660 | – | – | – | – | -93,660 |
| Liquidity surplus/deficit | – | 320,907 | 299,978 | 686,658 | 220,550 | 123,587 |
| 1,404,506 |
| Maturity calendar as at 31 December 2008 (in thousands of euros) | Direct | ≤ 3 months | ≤ 1 year | ≤ 5 years | >5 years | Total |
| Assets | ||||||
| Cash and deposits at the central | ||||||
| bank | 1,248,801 | – | – | – | – | 1,248,801 |
| Banks | 1,362,627 | 331,093 | – | – | – | 1,693,720 |
| Loans and advances | 2,375,915 | 49,922 | – | 45 | 8,051 | 2,433,933 |
| Reverse repurchase agreements | – | 732,641 | – | – | – | 732,641 |
| Investments at fair value through profitor loss | 5,583 | – | 1,020 | 4,080 | 30,600 | 41,283 |
| Available-for-sale investments | 31,122 | 127,368 | 189,535 | 200,860 | 238,094 | 786,979 |
| 5,024,048 | 1,241,024 | 190,555 | 204,985 | 276,745 | 6,937,357 | |
| Equity and liabilities | ||||||
| Banks | 1,198,965 | 18,166 | – | – | – | 1,217,131 |
| Funds entrusted | 5,096,959 | 423,322 | 3,747 | –5,524,028 | ||
| 6,295,924 | 441,488 | 3,747 | – | – | 6,741,159 | |
| Derivatives | ||||||
| Foreign exchange contracts | ||||||
| • Incoming cash flow | – | 12,166,139 | 303,704 | 41,376 | – | 12,511,219 |
| • Outgoing cash flow | – | 12,172,002 | -302,706 | -41,369 | – | -12,516,077 |
| Interest contracts | ||||||
| • Incoming cash flow | – | 441 | 16,287 | 15,192 | 42,424 | 74,344 |
| • Outgoing cash flow | – | -1,203 | -16,342 | -17,223 | -46,264 | -81,032 |
| Share contracts | – | 4 | 12 | 52 | – | 68 |
| Credit contracts | – | – | – | -255 | – | -255 |
| – | -6,621 | 955 | -2,227 | -3,840 | -11,733 | |
| Contingent positions | ||||||
| Guarantees and irrevocable | ||||||
| facilities | -142,636 | – | – | – | – | -142,636 |
| Liquidity surplus/(deficit) | -1,414,512 | 792,915 | 187,763 | 202,758 | 272,905 | 41,829 |
45. Credit risk
General
Credit risk is the risk of financial losses if a counterparty to a financial instrument defaults on its contractual obligations.
KAS BANK provides credit in the following forms:
Credit relating to securities transactions:
| • |
Lending based on collateral in the form of securities and cash; |
| • |
Lending based on limits. |
| • |
Credit relating to treasury activities: |
| • |
Securities lending and reverse purchase transactions |
| • |
Investments in money market instruments and derivatives |
| • |
Proprietary securities portfolio |
The credit management group is responsible for measuring and managing KAS BANK’s credit risk. The Treasury back office is in charge of monitoring the credit risk arising from our treasury activities. The credit management group and the Treasury back office report directly to the Head of Credit Risk Management and the Treasury Risk Management Committee.
KAS BANK’s credit policy is designed to limit the bank’s credit risks by, where possible, providing credit in return for collateral in the form of securities or cash. The Head of Credit Risk Management advises the Risk Management Committee on setting guidelines and limits for each counterparty. The bank’s Risk Management Committee’s approval is required for the finalised guidelines and limits. Approval for exceeding limits on a temporary or more permanent basis is the responsibility of the Chief Risk Officer or the Head of Credit Risk Management under the terms of an established mandate.
Developments in 2009
KAS BANK took various steps to mitigate the credit risk arising as a result of the financial crisis. These included:
| • |
Increased frequency of checking clients‘ credit ratings |
| • |
Withdrawal or reduction of credit limits |
| • |
Adjustment of the percentages of securities allowed to be used as collateral |
| • |
More active monitoring of clients to whom we lend other than on the basis of normal collateral |
| • |
Temporary discontinuation of, for example, contractual income and contractual settlement services |
| • |
Increase of securities lending haircuts |
| • |
No longer lending or accepting financial institutions‘ securities as collateral for securities lending |
| • |
Collateral to be received before securities are lent (prepayment) for securities lending |
| • |
More stringent monitoring of the quality of collateral, including its diversity and spread. |
Lending relating to securities transactions
To monitor the lending to clients in connection with the settlement of securities transactions, the credit management group makes use of a credit risk information system which quantifies the risks and performs a check on the collateral which has been put up. This system takes account of a client’s financial position on an integral basis across the various markets on which the client is active. This enables KAS BANK to monitor the risks inherent in clients‘ transactions which have not yet been settled as weII. Internal authorisation of client instructions is also subjected to this system. The credit management group reports excesses to the Head of Credit Risk Management and the Risk Management Committee.
The settling of securities transactions involves a settlement risk if KAS BANK delivers securities and/or cash, but does not receive anything from the counterparty. The standard basis for settling securities transactions is delivery on payment, meaning that securities are transferred as and when funds are received. Settlement does not take place until the adequacy of funds and/or security has been verified. The limits and collateral for transactions not based on delivery on payment are outlined below.
KAS BANK uses an internal rating system for monitoring credit risks on financial institutions. These internal ratings are reassessed every one to three years, depending on the risk classification and any interim developments affecting clients. The rating system is based partly on an analysis of clients‘ financial positions and partly on an analysis of the operating and business risks associated with the clients. The internal ratings are used for setting limits and to determine the level of margins required to be held in respect of securities transactions still to be settled.
Lending based on collateral in the form of securities and cash
Lending relating to settlement and clearing facilities is based on collateral in the form of securities and cash, where KAS BANK has a first pledge on the securities and cash. The Head of Credit Risk Management selects the shares that may be used as collateral for such lending and determines the applicable lending percentages.
These shares and percentages are updated at least once a year, mainly on the basis of the underlying volatility and liquidity of the specific shares. The Risk Management Committee is responsible for approving the system of lending conditions.
For the percentage which can be advanced against securities, use is made of the Basel II figures to establish the value of the securities offered as collateral. The way in which these percentages are applied takes account of such things as a) a system reflecting portfolio diversification, in which percentages are reduced for portfolios with limited diversification; b) exclusion of emerging markets and c) no advances against shares with a market capitalisation of less than €200 million.
KAS BANK provides only limited amounts of credit against unlisted securities in client portfolios. The Risk Management Committee has authorised exceptions for a number of clients, with a maximum being set both as a percentage and in absolute terms. These clients, most of whom are hedge funds and funds of funds, use these facilities mainly to facilitate changes in their investment portfolios. The investment funds in which the hedge funds and funds of funds have invested are used as collateral for these credit facilities.
Lending based on limits
Limits are put in place when lending is not fully covered by securities pledged as collateral. These limits are set by the bank’s Risk Management Committee, taking into account such things as the type of credit facility and the consequent potential exposure, the credit rating of the borrower, the financial position of the borrower, the Basel II risk weighting, any guarantees provided and the amount of existing borrowing by the borrower and related enterprises within the established credit limits.
The purpose of the limits is to facilitate settlement transactions, and in principle the limits are used for shortterm periods.
Lending relating to treasury activities
Lending arising from treasury activities relates primarily to securities lending and reverse purchase transactions, investments in money market instruments and derivatives and the proprietary securities positions.
Securities lending and reverse purchase transactions
KAS BANK acts, amongst other things, as principal in securities lending transactions. The borrower of the securities is under obligation to deposit collateral equivalent to the effective value plus a markup depending on the quality of the collateral furnished. Collateral may be lodged in the form of securities or cash. Where collateral takes the form of securities that may be repledged, it is lodged subject to the condition that the securities are returned. Collateral is lodged on behalf of lenders in the form of repledged securities or securities associated with reverse purchase agreements and the proprietary securities portfolio.
As part of the process of managing the risks in securities lending transactions, the Treasury back office assesses the amounts receivable from counterparties and the receipt of collateral of sufficient quality on a daily basis. The Treasury back office reports any deficits in collateral to Risk Management, while also reporting any excesses on the maximum positions set for each counterparty by the Risk Management Committee. These limits are reassessed at least once a year, based on an estimation of the client’s financial position.
The acceptance criteria include the rating of the collateral and the issuing institution, the spread and concentration of the borrower’s collateral portfolio, the liquidity of the securities and the position compared with the daily volume.
The receivables and liabilities in respect of securities lending mainly relate to receivables from and liabilities to financial institutions in the Netherlands and the European Union.
The following table shows the amounts receivable and payable in respect of securities lending, including collateral received.
| (in thousands of euros) | 2009 | 2008 |
| Receivables in respect of securities lending | ||
| Banks | 1,465,591 | 2,303,012 |
| Other parties | 28,062 | 82,581 |
| 1,493,653 | 2,385,593 | |
| Collateral received | ||
| Securities | 1,710,454 | 2,935,085 |
| Cash | 134,870 | 189,221 |
| 1,845,324 | 3,124,306 | |
| Liabilities in respect of securities lending | ||
| Banks | 72,331 | 2 |
| Other parties | 1,456,346 | 2,453,849 |
| 1,528,677 | 2,453,851 | |
| Collateral on behalf of lenders | ||
| Borrowers‘ repledged securities | 1,345,971 | 2,288,410 |
| Reverse repurchase agreements | 78,749 | 61,599 |
| Available-for-sale investments | 165,864 | 121,145 |
| 1,590,584 | 2,471,154 |
Treasury enters into reverse repurchase agreements in order to meet the bank’s requirements for collateral. KAS BANK’s reverse purchase agreements involve temporary purchases of state bonds, which are then sold to the same party for delivery at a later date. These agreements are always based on delivery on payment, which means there is no settlement risk. Treasury back office reports daily to the members of the Treasury Risk Management Committee regarding any exceeding the limits.
Investments in money market instruments and derivatives
Each year the Risk Management Committee sets limits for money market instruments and foreign currency positions for each counterparty. These limits are recorded in a risk management information system. Excesses on money market and currency limits have to be approved by the Head of Treasury. Treasury back office reports daily to the members of the Treasury Risk Management Committee regarding any exceeding of the limits.
KAS BANK uses investments in money market instruments (call money and deposits) primarily in order to manage liquidity surpluses and deficits. In principle, all money market investments are short-term investment and no collateral is provided. The credit risk relates to the nominal value of these investments. KAS BANK uses derivatives (currency and interest rate swaps) to hedge against changes in value relating to movements in exchange and interest rates.
As well as using limits, KAS BANK also settles foreign currency transactions with a CLS (Continuous Linked Settlement) member. A CLS member ensures that incoming and outgoing transactions are settled simultaneously so that no counterparty risk arises for KAS BANK. We also use International Swaps and Derivatives Association (ISDA) master agreements for derivative transactions. In addition, we have established a Credit Support Annex (CSA) with various parties that require cash collateral to be deposited to cover movements in the fair value of derivatives. In these cases, the credit risk is the fair value of the derivative less the collateral provided.
For interest rate swaps, KAS BANK operates a limit system based on the stock deposit limits. With all parties with which interest rate swaps are contracted, KAS BANK establishes a Credit Support Annex (CSA) that requires cash collateral to be deposited to cover movements in the fair value of derivatives. In these cases, the credit risk is the fair value of the derivative less the collateral provided.
Proprietary securities portfolio
KAS BANK limits the exposure to credit risk in its proprietary securities portfolio by investing solely in marketable securities and conducting transactions solely with counterparties with credit ratings of at least ‚A‘ from both Moody’s and Standard & Poors. The Risk Management Committee must approve any waiver of this minimum requirement.
The financial assets are rated as follows by Moody’s:
| (in thousands of euros) | 2009 | 2008 | ||||
| Available- for-sale investments | Investments at fair value through profit or loss | Total | Available-for- sale investments | Investments at fair value through profit or loss | Total | |
| Government/govern ment-g ua ra nteed | 783,224 | 154,630 | 937,854 | 174,391 | 26,893 | 201,284 |
| Other Aaa – Aa 3 | 401,466 | – | 401,466 | 335,837 | – | 335,837 |
| Total Aaa t/Aa 3 | 1,184,690 | 154,630 | 1,339,320 | 510,228 | 26,893 | 537,121 |
| A1 – A3 | 36,515 | – | 36,515 | 35,226 | – | 35,226 |
| Baa 1 – Baa 3 | 40,367 | – | 40,367 | 9,819 | – | 9,819 |
| P1 – P2 | – | – | – | 99,595 | – | 99,595 |
| Shares | 27,698 | – | 27,698 | 27,572 | 5,583 | 33,155 |
| Total | 1,289,270 | 154,630 | 1,443,900 | 682,440 | 32,476 | 714,916 |
The credit quality of financial assets not included in the above analysis is monitored on the basis of set limits and the collateral received instead of ratings.
The shares in the proprietary portfolio are mainly index trackers and interests in securities and clearing organisations.
Maximum credit risk
For all financial assets, the maximum credit risk, without taking account of collateral received, is equal to the carrying amounts shown on the face of the consolidated balance sheet, which already have any impairment losses deducted.
Concentration risk
The credit risk also includes the concentration risk, which can take two forms. Firstly it can involve excessive amounts placed with a single party or a number of closely related parties. This risk is managed by means of a system of limits and the large-exposure regulations, while our spread of clients helps, for example, to ensure that this aspect is not a major risk for KAS BANK. Secondly, credit risks may also be concentrated in a single country or sector. Most of our credit risk exposure is to financial institutions, and this means an element of concentration risk. Mitigating factors are the spread of risk within our client base (and among our clients‘ clients), the fact that most of our lending is secured by collateral, the existence of a good infrastructure on and off exchange with guarantees for the settlement of securities transactions entered into and effective supervision of our client group.
Financial sector concentration risk
| (in thousands of euros) | Central government | Financial institutions | Institutional investors | Other | Total |
| Concentration by segment in 2009 | |||||
| Cash and deposits at the central bank | 469,340 | – | – | – | 469,340 |
| Banks and loans and advances | – | 2,826,817 | 730,425 | 57,366 | 3,614,608 |
| Reverse repurchase agreements | – | 419,183 | 165,163 | – | 584,346 |
| Derivative financial instruments (assets) | – | 31,813 | 55,541 | 4,787 | 92,141 |
| Investments at fair value through profit orloss | 77,057 | 77,573 | 154,630 | ||
| Available-for-sale investments | 161,122 | 1,079,021 | – | 49,127 | 1,289,270 |
| 707,519 | 4,434,407 | 951,129 | 111,280 | 6,204,335 | |
| Concentration by segment in 2008 | |||||
| Cash and deposits at the central bank | 1,248,801 | – | – | – | 1,248,801 |
| Banks and loans and advances | – | 1,746,341 | 2,164,167 | 217,145 | 4,127,653 |
| Reverse repurchase agreements | – | 674,433 | 58,208 | – | 732,641 |
| Derivative financial instruments (assets) | – | 271,774 | 110,244 | 4,077 | 386,095 |
| Investments at fair value through profit or loss | 26,893 | 5,583 | 32,476 | ||
| Available-for-sale investments | 160,801 | 475,804 | – | 45,835 | 682,440 |
| 1,436,495 | 3,168,352 | 2,332,619 | 272,640 | 7,210,106 |
| (in thousands of euros) | Netherlands | Rest of European Union | Other | Total |
| Concentration by region 2009 | ||||
| Cash and deposits at the central bank | 469,340 | – | – | 469,340 |
| Banks and loans and advances | 3,251,292 | 298,574 | 64,742 | 3,614,608 |
| Reverse repurchase agreements | 374,507 | 209,839 | – | 584,346 |
| Derivative financial instruments (assets) | 74,330 | 16,791 | 1,020 | 92,141 |
| 129,509 | 25,121 | – | 154,630 | |
| Investments at fair value through profit or loss | ||||
| Available-for-sale investments | 449,809 | 809,288 | 30,173 | 1,289,270 |
| 4,748,787 | 1,359,613 | 95,935 | 6,204,335 | |
| Concentration by region 2008 | ||||
| Cash and deposits at the central bank | 1,248,801 | – | – | 1,248,801 |
| Banks and loans and advances | 3,279,348 | 398,401 | 449,904 | 4,127,653 |
| Reverse repurchase agreements | 526,471 | 206,170 | – | 732,641 |
| Derivative financial instruments (assets) | 204,205 | 177,317 | 4,573 | 386,095 |
| Investments at fair value through profit or loss | 26,893 | 5,583 | – | 32,476 |
| Available-for-sale investments | 238,655 | 437,067 | 6,718 | 682,440 |
| 5,524,373 | 1,224,538 | 461,195 | 7,210,106 |
Collateral received for lending
Loans to banks and other loans and advances are largely covered by the pledge of securities and mortgages. Where possible, agreements are also reached with clients to enable receivables and payables to be settled on a net basis. KAS BANK is not at liberty to dispose of or pledge securities furnished as collateral as long as clients meet their obligations.
Risk-weighted value of loans and advances
The following table shows the credit-risk exposure, weighted at the percentages used for regular reporting to the Dutch Central Bank. These weightings are generally 0% for receivables from or guaranteed by European public authorities, 10% for covered bonds, 20% for receivables from or guaranteed by European banks and 100% for receivables from other counterparties.
| (in thousands of euros) | Carrying amount 31-12-09 | Risk-weighted amount 31-12-09 | Carrying amount 31-12-08 | Risk-weighted amount 31-12-08 |
| Banks | 2,707,426 | 83,207 | 1,693,720 | 144,951 |
| Loans and advances | 907,182 | 45,374 | 2,433,933 | 81,526 |
| Reverse repurchase agreements | 584,346 | 597 | 732,641 | 8 |
| Derivative financial instruments | 92,141 | 74,697 | 386,095 | 140,699 |
| Investments at fair value through profit or loss | 154,630 | – | 32,446 | – |
| Available-for-sale investme nts | 1,289,270 | 126,087 | 682,440 | 110,669 |
| Property and equipment | 44,062 | 44,062 | 50,690 | 50,690 |
| Other balance sheet items | 550,627 | 59,937 | 1,348,273 | 131,912 |
| 6,329,684 | 433,961 | 7,360,238 | 660,455 | |
| Contingent liabilities | 30,844 | 5,489 | 84,615 | 7,454 |
| Irrevocable facilities | 62,816 | – | 58,021 | – |
| Operational risk | 252,375 | 230,062 | ||
| Securities lending | 14,930 | 41,716 | ||
| Total of the risk-weighted items | 706,755 | 939,687 | ||
| 31-12-09 | BIS 31-12-09 | 31-12-08 | BIS 31-12-08 | |
| Tier 1 | 144,991 | 21% | 141,253 | 15% |
| Tier 2 | 22,274 | 24,370 | ||
| Total BIS | 167,265 | 24% | 165,623 | 18% |
The collateral lodged is taken into account in calculating the risk-weighted value of items in the balance sheet. An amount of €2.6 billion (2008: €3.0 billion) has been netted off for receivables and payables in respect of the same natural person, legal entity or group of jointly and severally liable legal entities where the bank has the right and intention of set-off and the asset is due immediately or has a maturity the same as or longer than the liability.
Provisions and impairments
Clients experiencing financial problems are transferred to special credit monitoring and are actively monitored by the Head of Credit Risk Management in order to ensure the relationship with the client is properly managed and to minimise the risk to KAS BANK.
The financial crisis resulted in impairments in the value of debit balances held by clients and in our proprietary securities positions in 2008, as well as limited impairments in 2009.
The bank shows impairments in the value of loans and debt instruments (with any movements being taken to shareholders‘ equity) if there is objective evidence that cash flows of interest and principal will not be received on the expected dates (usually the dates specified in contractual terms and conditions).
Overdue accounts and impairments
| (in thousands of euros) | Cash and deposits at the central bank | Banks and loans and advances | Reverse repurchase agreements | Derivative financial through instruments | Investments at fair value profit or loss: | Available- for-sale investments |
| 2009 | ||||||
| Total carrying amount | 469,340 | 3,614,608 | 584,346 | 92,141 | 154,630 | 1,289,270 |
| Individual impairments: | ||||||
| Carrying amount before | ||||||
| impairments | – | 42,051 | – | – | – | 50,328 |
| Impairment losses | -36,948 | -25,747 | ||||
| Carrying amount after impairments | – | 5,103 | – | – | – | 24,581 |
| Not overdue; | ||||||
| no impairments | 469,340 | 3,609,505 | 584,346 | 92,141 | 154,630 | 1,264,689 |
| 2008 | ||||||
| Total carrying amount | 1,248,801 | 4,127,653 | 732,641 | 386,095 | 32,476 | 682,440 |
| Individual impairments: | ||||||
| Carrying amount before | ||||||
| impairments | – | 47,601 | – | – | – | 46,127 |
| Impairment losses | -35,299 | -32,890 | ||||
| Carrying amount after impairments | – | 12,302 | – | – | – | 13,237 |
| Not overdue; no impairments | 1,248,801 | 4,115,351 | 732,641 | 386,095 | 32,476 | 669,203 |
Appropriated collateral
Clients that have been placed under special management are actively monitored by the Head of Credit Risk Management. If the Head of Credit Risk Management can see no alternative, the collateral security with which we have been provided is appropriated. KAS BANK policy is to cash in appropriated assets by selling them immediately. In 2009 for a small number of clients, KAS BANK appropriated collateral security with a carrying amount of about €6.5 million. If the market for the securities concerned is not sufficiently liquid, they are disposed of in tranches with the object of maximising the proceeds from sale.
46. Operational risk
General
The operational risk is the risk that losses will occur as a result of weaknesses or failures in internal processes and/or systems, human frailties or outside events. These risks include operational risks such as IT problems, poor organisational structure, absent or inadequate internal controls, human error, fraud and external threats.
Managing operational risk
The Managing Board adopted a more stringent operational risk policy during the year, fundamental to which is that management is responsible for identifying and analysing operational risks and implementing adequate control measures. Experts in the field of systems organisation and internal control and an operational risk management have been appointed to help management perform this task and, by conducting operational audits, the Internal Audit Department performs a monitoring role.
KAS BANK’s operational risk policy is also underpinned in the following ways:
| • |
For each process there is a control structure in place, in which the process, inherent risks, control objectives and control measures are all documented. These control structures are periodically evaluated on the basis of risk self-assessments, assessments performed by the Risk Management Department and operational audits. |
| • |
Operational risks are continuously monitored by means of the Quality Dashboard that was set up during the year. |
| • |
Systematic records are kept of losses attributable to operational risks in an Operational Loss Database. The recorded events are periodically analysed; |
| • |
Analysis of events and risks, including proposals for improving processes; |
| • |
Ongoing attention to further enhancing risk and quality awareness among staff; |
| • |
Training and professional development are important elements in staff performance; |
| • |
In order to manage the continuity risk we have established a Business Continuity function, which keeps and updates recovery and resolution plans. The Business Continuity Manager reports to the Risk Management Committee. |
| • |
In order to manage the continuity risk we have established a Business Continuity function, which keeps and updates recovery and resolution plans. |
The three internal lines of defence and (as a fourth independent line of defence) the external auditors and regulators report any shortcomings identified in the structure, existence and functioning of internal controls to the Risk Management Committee, the Managing Board and/or the Audit Committee. The Risk Management Committee assesses the risk and decides on action to be taken in the form of temporary and/or structural measures in order to remedy the shortcoming. The Chief Risk Officer and Internal Audit Department report to the Risk Management Committee on how such decisions have been followed up.
Various scenarios have been examined in order to see the effects that operational risk stress-testing has on shareholders‘ equity. These exceptional, but still plausible scenarios were selected and examined in liaison with the line management organisation and based partly on actual or extrapolated losses. The stress-testing framework is reassessed at least once every year and any required changes made. It was concluded from the potential losses in the various stress-testing scenarios that the bank’s shareholders‘ equity was sufficient to absorb such losses.
Each year KAS BANK compiles an SAS70 Type II report. This report (the ‚in control statement‘) is compiled in order to indicate the extent to which the internal control measures are effective in achieving the process objectives.
47. Compliance risk
General
Compliance risk concerns the risk of sanctions imposed under the law or by regulat ors and of material financial losses or damaged reputation which the bank might incur as a result of failure to comply with codes of conduct applicable to its activities.
Structure and scope of the compliance function
The compliance function is organisationally part of Risk Management. It focuses on managing the risks arising from legislation and regulations, including legislation and regulations specific to the financial services sector. The compliance function supports the organisation in implementing new legislation and regulations. KAS BANK has established arrangements for dealing with insider information and private securities transactions and also has regulations in place for whistleblowers. The whistleblower arrangements encourage employees to report any actual or suspected violations of legislation and regulations or internal policy and are designed to protect KAS BANK employees who report abuses.
One of the important preconditions for compliance with the rules is the need for employees to know the rules and understand their importance. Various forms of training and communications are used to support this process.
As well as providing support for the organisation, the Compliance Officer’s duties also include monitoring clientrelated integrity risks, such as money laundering and the funding of terrorists, and also integrity risks arising from the behaviour of individuals, such as insider trading.
48. Fair value of financial assets and liabilities
The following table shows the fair value of KAS BANK’s assets and liabilities. Balance sheet items not included in this table do not meet the definition of a financial asset or liability. The total of the fair values does not equate to the underlying value of KAS BANK.
| (in thousands of euros) | 2009 | 2008 | ||
| Fair value | Carrying amount | Fair value | Carrying amount | |
| Financial assets | ||||
| Cash and deposits at the central bank | 469,340 | 469,340 | 1,248,801 | 1,248,801 |
| Banks | 2,707,419 | 2,707,426 | 1,693,831 | 1,693,720 |
| Loans and advances | 907,183 | 907,182 | 2,433,936 | 2,433,933 |
| Reverse repurchase agreements | 584,346 | 584,346 | 732,641 | 732,641 |
| Derivative financial instruments | 92,141 | 92,141 | 386,095 | 386,095 |
| Investments at fair value through profit or loss | 154,630 | 154,630 | 32,476 | 32,476 |
| Available-for-sale investments | 1,289,270 | 1,289,270 | 682,440 | 682,440 |
| Financial liabilities | ||||
| Banks | 2,328,351 | 2,328,351 | 1,217,135 | 1,217,131 |
| Funds entrusted | 3,649,556 | 3,649,066 | 5,525,027 | 5,524,028 |
| Derivative financial instruments | 116,144 | 116,144 | 395,689 | 395,689 |
| Other liabilities | 1,235 | 1,235 | 12,216 | 12,216 |
The following table presents the financial instruments that are carried at fair value, analysed by the method by which the fair value is measured. There are three levels of measurement method:
| • |
Level 1: quoted bid prices in an active market |
| • |
Level 2: valuation techniques or models using observable market-related data other than quoted bid prices as used in level 1, whether direct (e.g. actual prices) or indirect (e.g. derived prices) |
| • |
Level 3: valuation techniques or models using variables not based on observable market-related data. |
| 31 December 2009 (in thousands of euros) |
Level 1 | Level 2 | Level 3 | Cost | Total |
| Derivative financial instruments (assets) | 3 | 92,138 | – | – | 92,141 |
| Investments at fair value through profit or loss: | |||||
| • Investments held for trading | – | – | – | – | – |
| • Investments classified as assets | |||||
| measured at fair value through profit or loss | 154,630 | 154,630 | |||
| Available-for-sale investments | |||||
| • Money market instruments | 240,000 | – | – | – | 240,000 |
| • Bonds | 1,005,239 | 16,333 | – | – | 1,021,572 |
| • Shares | 19,909 | 3,721 | 3,080 | 988 | 27,698 |
| Subtotal | 1,419,781 | 112,192 | 3,080 | 988 | 1,536,041 |
| Derivative financial instruments (liabilities) | 321 | 115,823 | – | – | 116,144 |
| Total | 1,419,460 | -3,631 | 3,080 | 988 | 1,419,897 |
| 31 December 2008 (in thousands of euros) |
Level 1 | Level 2 | Level 3 | Cost | Total |
| Derivative financial instruments (assets) | 68 | 386,027 | – | – | 386,095 |
| Investments at fair value through profit or loss: | |||||
| • Investments held for trading | 5,583 | – | – | – | 5,583 |
| • Investments classified as assets measured at | |||||
| fair value through profit or loss | 26,893 | 26,893 | |||
| Available-for-sale investments | |||||
| • Money market instruments | 99,595 | – | – | 99,595 | |
| • Bonds | 538,561 | 16,712 | – | – | 555,273 |
| • Shares | 19,261 | 7,297 | -1,014 | 27,572 | |
| Subtotal | 590,366 | 509,631 | – | 1,014 | 1,101,011 |
| Derivative financial instruments (liabilities) | 395,689 | 395,689 | |||
| Total | 590,366 | 113,942 | -1,014 | 705,322 |
Reconciliation of fair value at level 3
The changes in financial instruments where the fair value is measured using a level 3 method were as follows:
| Available-for-sale investments | |
| Position as at 1 January 2009 | – |
| Acquired from appropriated collateral | 6,610 |
| Sales and settlements | -6,190 |
| Reclassification from/to level 3 | – |
| Total income/expense: | |
| • Available-for-sale investments (through profit or loss) | 2,542 |
| • Impairments (through profit or loss) | -218 |
| • Income and expense recognised directly in equity | 336 |
| Position as at 31 December 2009 | 3,080 |
Measurement of the carrying amounts of these financial instruments is partly based on liquidation sale prices because of insufficient trade in the instruments concerned (no observable data). The following table shows the sensitivity of the fair value as at 31 December 2009 to reasonable alternative assumptions for the sale price (10% higher or lower, if possible):
| Through profit or loss | Income and expense recognised in directly equity | |||
| (in thousands of euros) | More favourable assumption | Less favourable assumption | More favourable assumption | Less favourable assumption |
| Available-for-sale investments | 150 | -150 | 324 | -341 |
49. Classification of financial assets and liabilities
The following table gives an insight into the classification of KAS BANK’s assets and liabilities.
| 31 December 2009 (in thousands of euros) |
Financial instruments at amortised cost | Financial instruments at fair value through profit or loss | Available-for-sale investments | Total | |||
| Designated | Trading purposes | Hedge accounting | No hedge accounting | Hedge accounting | |||
| Assets | |||||||
| Cash and deposits at the central bank | 469,340 | 469,340 | |||||
| Banks | 2,707,426 | 2,707,426 | |||||
| Loans and advances | 907,182 | 907,182 | |||||
| Reverse repurchase ag reements | 584,346 | 584,346 | |||||
| Derivative financial instruments | 92,006 | 135 | 92,141 | ||||
| Investments at fair value through profit or loss | 154,630 | 154,630 | |||||
| Ava i la b le-for-sa le investments | 674,448 | 614,822 | 1,289,270 | ||||
| Total assets Liabilities | 4,668,294 | 154,630 | 92,006 | 135 | 674,448 | 614,822 | 6,204,335 |
| Banks | 2,328,351 | 2,328,351 | |||||
| Funds entrusted | 3,649,066 | 3,649,066 | |||||
| Derivative financial | |||||||
| instruments | 107,343 | 8,801 | 116,144 | ||||
| Total liabilities | 5,977,417 | – | 107,343 | 8,801 | – | – | 6,093,561 |
| 31 December 2008 (in thousands of euros) |
Financial instruments at amortised cost | Financial instruments at fair value through profit or loss | Available-for-sale investments | Total | |||
| Designated | Trading purposes | Hedge accounting | No hedge accounting | Hedge accounting | |||
| Assets | |||||||
| Cash and deposits at the central bank | 1,248,801 | 1,248,801 | |||||
| Banks | 1,693,720 | 1,693,720 | |||||
| Loans and advances | 2,433,933 | 2,433,933 | |||||
| Reverse repurchase agreements | 732,641 | 732,641 | |||||
| Derivative financial instruments | 385,943 | 152 | 386,095 | ||||
| Investments at fair value through profit or loss | 26,893 | 5,583 | 32,476 | ||||
| Available-for-sale investments | 641,990 | 40,450 | 682,440 | ||||
| Total assets Liabilities | 6,109,095 | 26,893 | 391,526 | 152 | 641,990 | 40,450 | 7,210,106 |
| Banks | 1,217,131 | 1,217,131 | |||||
| Funds entrusted | 5,524,028 | 5,524,028 | |||||
| Derivative financial instruments | 394,423 | 1,266 | 395,689 | ||||
| Totalliabilities | 6,741,159 | – | 394,423 | 1,266 | – | – | 7,136,848 |
Segment information
50. Segment information
KAS BANK’s specialised products and services are aimed at two main target groups, viz. institutional investors and financial institutions. Another important activity is treasury. This segmentation reflects the structure of the internal management information provided to the Managing Board.
Operating segmentation
| 2009 (in millions of euros) |
Financial institutions | Institutional investors | Treasury | Other | Total |
| Interest income and expense 1 | 7.4 | 16.6 | 6.6 | – | 30.6 |
| Commission income and expense: | |||||
| – Custody and IMS | 2.9 | 27.2 | – | – | 30.1 |
| – Clearing & settlement | 19.8 | 14.0 | – | – | 33.8 |
| – Securities borrowing and lending | 0.4 | 3.5 | 1.2 | – | 5.1 |
| – Other commission | 1.6 | 4.4 | 0.3 | – | 6.3 |
| Result on investments | 0.6 | 6.9 | 16.5 | – | 24.0 |
| Other income | 0.5 | 1.5 | – | – | 2.0 |
| Exceptional income | – | – | – | 4.9 | 4.9 |
| Total income | 33.2 | 74.1 | 24.6 | 4.9 | 136.8 |
| Operating expenses (direct) | -36.7 | -45.0 | -3.8 | -1.6 | -87.1 |
| Profit contribution | -3.5 | 29.1 | 20.8 | 3.3 | 49.7 |
| Operating expenses (overhead) | -17.4 | -17.4 | |||
| Exceptional expenses | -0.5 | -0.5 | |||
| Result for the period before tax | 31.8 | ||||
| 2008 (in millions of euros) institutions |
Financial | Institutional investors | Treasury | Other | Total |
| Interest income and expense 1 | 10.7 | 19.5 | -1.3 | – | 28.9 |
| Commission income and expense: | |||||
| – Custody and IMS | 4.0 | 24.7 | – | – | 28.7 |
| – Clearing & settlement | 24.6 | 13.0 | – | – | 37.6 |
| – Securities borrowing and lending | 0.9 | 10.5 | 5.7 | – | 17.1 |
| – Other commission | 2.0 | 3.6 | 0.1 | – | 5.7 |
| Result on investments | 1.7 | 10.2 | 1.7 | – | 13.6 |
| Other income | 0.4 | 0.3 | – | – | 0.7 |
| Exceptional income | – | – | – | -2.7 | -2.7 |
| Total income | 44.3 | 81.8 | 6.2 | -2.7 | 129.6 |
| Operating expenses (direct) | -35.3 | -45.8 | -4.4 | – | -85.5 |
| Profit contribution | 9.0 | 36.0 | 1.8 | -2.7 | 44.1 |
| Operating expenses (overhead) | -21.8 | -21.8 | |||
| Exceptional expenses | -74.3 | -74.3 | |||
| Result for the period before tax | -52,0 |
1 Interest income and expense is allocated to the financial institutions and institutional investors segments on the basis of the difference between the external interest rates and benchmarks. The benchmarks are based on interbank or central bank rates.
Geographical segmentation
KAS BANK has Dutch, European and other international clients. Support is provided to these clients from Amsterdam, London and Wiesbaden. The London office serves the UK market and many of the international clients. The Wiesbaden office serves several German investment funds.
Processing is mainly carried out on the IT systems in Amsterdam.
| Geographical segmentation of income (in millions of euros) | 2009 | 2008 |
| Country of residence KAS BANK | ||
| Netherlands | 122.4 | 114.1 |
| OtherEurope | 14.4 | 15.5 |
| Total | 136.8 | 129.6 |
| Geographical segmentation of the property and equipment and intangible assets (in millions of euros) | 2009 | 2008 |
| Country of residence KAS BANK | ||
| Netherlands | 50.5 | 57.9 |
| OtherEurope | 14.6 | 10.0 |
| Total | 65.1 | 67.9 |
Concentration of income
KAS BANK has a broad client base. KAS BANK’s 25 largest clients account of 39% (2008: 49%) of the total income. At the same time, KAS BANK does not have any one client (2008 none) accounting for more than 10% of the total income.
Share-based payments and related parties
51. Share-based payments
Description of share and option plans
KAS BANK operates share and option plans for the members of the Managing Board, former members of the Managing Board and other staff. Each option confers the right to one depositary receipt for a share of €1.00 nominal value.
Option plan for the Managing Board (up to year-end 2006) and other staff
The tranches up to year-end 2005 are already vested and remain valid for five years. For the tranches from 2006 onwards, a vesting period of three years applies. The members of the Managing Board and several key officers have the right to extend by two years the expiry dates of one third of the options granted in respect of 2002 and subsequent years. For the tranches from 2007 onwards, this possibility also applies to the entire top echelon and, for the tranches from 2008 onwards, also to the other staff. A separate option scheme for members of the Managing Board applies with effect from 2007.
| Options not yet vested | Options | ||
| Date of award | March 2009 | March 2008 | March 2007 |
| Fair value at date of award | €1.84/€2.00 | €2.42/€3.64 | €1.43/€1.10 |
| Share price at date of award | €8.31 | €26.00 | €22.89 |
| Exercise price | €8.31 | €26.00 | €22.89 |
| Validity of options (including vesting period) | 5/7 years | 5/7 years | 5/7 years |
| Vesting period | 3 years | 3 years | 3 years |
| Vesting condition | Uninterrupted employment | Uninterrupted employment | Uninterrupted employment |
| Expected dividend yield | 4.50%/4.50% | 7.50%/7.50% | 7.70% |
| Expected volatility | 31.73%/29.74% | 20.31%/25.23% | 17.17% |
| Risk-free interest rate | 2.74%/3.08% | 3.65%/3.87% | 4.04%/4.08% |
Share plan for the Managing Board (up to year -end 2006)
A different share plan applied to members of the Managing Board up to the end of 2006.
The members of the Managing Board were rewarded with performance shares provided that they achieved predetermined targets. The shares were conditionally awarded, becoming vested (including accrued dividend) three years after being granted. Members of the Managing Board to whom shares have been awarded must also still be in the company’s employment or have retired from company employment on pre-pension benefits or on an ordinary retirement pension at the time when the award becomes unconditional.
The Appointments and Remuneration Committee determined the number of shares to be awarded each year according to the performance of the Managing Board members, submitting its recommendation to the Supervisory Board for ratification. The achievement of target performance resulted in the award of the equivalent of one month’s salary in shares at the weighted average share price of the previous year. Shares awarded under this plan are to be kept for a period of five years following their award.
Share plan for the Managing Board (from 2007 onwards)
The Appointments and Remuneration Committee determines the number of shares and options to be awarded each year according to the performance of the Managing Board members, submitting its recommendation to the Supervisory Board for ratification.
The shares and options are conditionally granted, becoming vested three years after being granted on condition that the members of the Managing Board have achieved their targets. Members of the Managing Board to whom shares and options have been granted must also still be in the company’s employment or have retired from company employment on a retirement pension at the time when the award becomes unconditional. After the award of shares becomes unconditional, they must be kept for at least a further two years. The options are valid for a further five years after becoming vested.
In 2009, the Appointments and Remuneration Committee reviewed the performance criteria, recognising that an extreme result in any one year had an excessive influence on the performance, with the result that application of the performance criteria could have an undesirable impact on the overall remuneration of the members of the Managing Board. This prompted the Appointments and Remuneration Committee to change various aspects of the performance criteria. The underlying principles of the new policy are:
| • |
The long-term variable remuneration target is the target set for the members of the Managing Board, i.e. budget less 10% (no change); |
| • |
Profit growth is measured on the basis of KAS BANK’s result from normal operations in any one year, adjusted for certain exceptional items determined by the Supervisory Board, compared with the long -term variable remuneration target (no change); |
| • |
In the event of profit growth more than 5% above the long-term variable remuneration target, a certain percentage of the initially awarded options and shares will be accrued. In the event of profit growth more than 5% below the long-term variable remuneration target, a certain reduction in the percentage of the initially awarded options on shares will be accrued. The sum of the percentages over a period of three years will determine the percentage of the initially awarded options and shares that ultimately becomes vested (change). |
| Profit growth relative to long- term variable remuneration target in any one year | Long-term variable remuneration addition in any one year | Profit growth relative to long-term variable remuneration target in any one year | Long-term variable remuneration reduction in any one year |
| 5% | 0 | 5% to -5% | 0 |
| 6% | 6.66% | -6% | -0.74% |
| 7% | 13.3% | -7% | -1.5% |
| 8% | 20% | -8% | -2.2% |
| 9% | 26.66% | -9% | -3% |
| 10% | 33.33% | -10% | -3.7% |
| 11% | 35% | -11% | -4.4% |
| 12% | 36.6% | -12% | -5.2% |
| 13% | 38.3% | -13% | -5.9% |
| 14% | 39.9% | -14% | -6.7% |
| 15% | 41.6% | -15% | -7.5% |
| 16% | 43.3% | -20% | -11.1% |
| 17% | 44.9% | -25% | -14.7% |
| 18% | 46.6% | -30% | -18.4% |
| 19% | 48.3% | -35% | -22.2% |
| 20% | 50% | -40% | -25.8% |
| >20% | 50% | -45% | -29.5% |
| -50% | -33.3% | ||
| <-50% | -33.3% |
In determining the costs of share-based payments, this policy already takes account of the discretionary room for manoeuvre of the Supervisory Board. Where the policy results in more options and shares becoming vested, the costs of these additional options and shares have been measured at the fair value as at year-end 2009.
The characteristics of the originally awarded options and shares are:
| Shares | Options | |||||
| Date of award | January 2009 | January 2008 | January 2007 | January 2009 | January 2008 | January 2007 |
| Fair value at date of award | €8.07 | €19.82 | €16.36 | €2.68 | €3.68 | €1.53 |
| Share price at date of award | €9.90 | €25.00 | €20.85 | €9.90 | €25.00 | €20.85 |
| Exercise price | n/a | n/a | n/a | €9.90 | €25.00 | €20.85 |
| Validity | 5 years | 5 years | 5 years | 8 years | 8 years | 8 years |
| Vesting period | 3 years | 3 years | 3 years | 3 years | 3 years | 3 years |
| Vesting condition | Uninterrupted employment plus above criteria | Uninterrupted employment plus above criteria | Uninterrupted employment plus above criteria | Uninterrupted employment plus above criteria | Uninterrupted employment plus above criteria | Uninterrupted employment plus above criteria |
| Expected dividend yield | 4.50% | 7.70% | 4.80% | 4.50% | 7.50% | 9.03% |
| Expected volatility | 31.67% | 17.17% | 18.57% | 30.85% | 24.78% | 18.57% |
| Risk-free interest rate | 3.25% | 4.04% | 4.00% | 3.62% | 4.41% | 3.95% |
The characteristics of the additional options becoming vested are:
| Shares | Options | |||||
| Original date of award | January 2009 | January 2008 | January 2007 | January 2009 | January 2008 | January 2007 |
| Change date | December 2009 | December 2009 | December 2009 | December 2009 | December 2009 | December 2009 |
| Fair value on change date | €11.90 | €12.37 | €12.88 | €5.20 | €1.50 | €2.03 |
| Share price on change date | €14.05 | €14.05 | €14.05 | €14.05 | €14.05 | €14.05 |
| Exercise price | n/a | n/a | n/a | €9.90 | €25.00 | €20.85 |
| Validity as from original date of award | 5 years | 5 years | 5 years | 8 years | 8 years | 8 years |
| Vesting period as from original date of award | 3 years | 3 years | 3 years | 3 years | 3 years | 3 years |
| Vesting condition | Uninterrupted employment plus above criteria | Uninterrupted employment plus above criteria | Uninterrupted employment plus above criteria | Uninterrupted employment plus above criteria | Uninterrupted employment plus above criteria | Uninterrupted employment plus above criteria |
| Expected dividend yield | 4.50% | 4.50% | 4.50% | 4.50% | 4.50% | 4.50% |
| Expected volatility | 38.37% | 43.82% | 50.21% | 31.05% | 32.71% | 35.47% |
| Risk-free int erest rate | 2.53% | 2.21% | 1.79% | 3.21% | 3.01% | 2.79% |
Share-based payments in the income statement
The fair value is calculated using the trinomial valuation method on the basis of the input from the above statements. The expected volatility is estimated on the basis of the historical average volatility over a period equal to the validity of the share or option plan. This value is charged to the income statement (staff costs) over the vesting period and credited to equity.
The fair value of the shares and options are awarded in the year can be analysed as follows:
| (in thousands of euros) | 2009 | 2008 |
| Option plans, Managing Board | 368 | 255 |
| Share plans, Managing Board | 166 | 105 |
| Option plans, other staff | 312 | 1.074 |
| Total | 846 | 1.434 |
The amount of the share-based payment in the income statement is made up as follows:
| (in thousands of euros) | 2009 | 2008 |
| Option plans, Managing Board | 206 | 80 |
| Share plans, Managing Board | 79 | 72 |
| Option plans, other staff | 511 | 495 |
| Total | 796 | 647 |
Options awarded
The following statement (next page) presents the position with regard to the numbers of options awarded to existing and former members of the Managing Board and the other staff.
| Expiry date | Exercise price in € |
Outstanding as at 31-12 – 2008 | Conditionally awarded | Exercised | Expired | Outstanding as at 31-12- 2009 | Status | |
| Management Board | ||||||||
| A.A. Röell | March 2010 | 17.10 | 813 | 813 | Vested | |||
| March 2012 | 17.10 | 407 | 407 | Vested | ||||
| March 2011 | 20.74 | 9,760 | 9,760 | Vested | ||||
| March 2013 | 20.74 | 4,880 | 4,880 | Vested | ||||
| March 2012 | 22.89 | 9,760 | 9,760 | Not yet vested | ||||
| March 2014 | 22.89 | 4,880 | 4,880 | Not yet vested | ||||
| January | 20.85 | 53,104 | 53,104 | Not yet vested | ||||
| 2015 | ||||||||
| January | 25.00 | 45,812 | 45,812 | Not yet vested | ||||
| 2016 | ||||||||
| January | 9.90 | – | 42,475 | 42,475 | Not yet vested | |||
| 2017 | ||||||||
| N.E. Blom | March 2009 | 15.32 | 3,000 | 3,000 | – | |||
| March 2010 | 17.10 | 3,000 | 3,000 | Vested | ||||
| March 2011 | 20.74 | 2,667 | 2,667 | Vested | ||||
| March 2013 | 20.74 | 1,333 | 1,333 | Vested | ||||
| March 2012 | 22.89 | 7,813 | 7,813 | Not yet vested | ||||
| March 2014 | 22.89 | 3,907 | 3,907 | Not yet vested | ||||
| January | 20.85 | 24,837 | 24,837 | Not yet vested | ||||
| 2015 | ||||||||
| January | 25.00 | 23,560 | 23,560 | Not yet vested | ||||
| 2016 | ||||||||
| January | 9.90 | – | 21,844 | 21,844 | Not yet vested | |||
| 2017 | ||||||||
| R.J. Kooijman | January | 9.90 | – | 24,271 | 24,271 | Not yet vested | ||
| 2017 | ||||||||
| January | 9.90 | – | 37,136 | 37,136 | Not yet vested * | |||
| 2017 | ||||||||
| S.A.J. van Katwijk | January 2017 | 9.90 | – | 11,426 | 11,426 | Not yet vested | ||
| Former Managing Board members | ||||||||
| March 2009 | 15.32 | 14,510 | 14,510 | – | ||||
| March 2011 | 15.32 | 4,880 | 4,880 | Vested | ||||
| March 2010 | 17.10 | 22,133 | 22,133 | Vested | ||||
| March 2012 | 17.10 | 11,067 | 11,067 | Vested | ||||
| March 2011 | 20.74 | 19,693 | 19,693 | Vested | ||||
| March 2013 | 20.74 | 9,847 | 9,847 | Vested | ||||
| March 2012 | 22.89 | 7,813 | 7,813 | Not yet vested | ||||
| March 2014 | 22.89 | 3,907 | 3,907 | Not yet vested | ||||
| January | 20.85 | 29,261 | 29,261 | Not yet vested | ||||
| 2015 | ||||||||
| Other staff | ||||||||
| March 2009 | 20.10 | 3,270 | 3,270 | – | Vested | |||
| March 2009 | 15.32 | 21,346 | 21,346 | – | Vested | |||
| March 2011 | 15.32 | 3,000 | 3,000 | Vested | ||||
| March 2010 | 17.10 | 52,650 | 4,371 | 48,279 | Vested | |||
| March 2012 | 17.10 | 1,854 | -4,146 | 6,000 | Vested | |||
| March 2011 | 20.74 | 147,797 | 6,200 | 141,597 | Vested | |||
| March 2013 | 20.74 | 7,880 | -2,000 | 9,880 | Vested | |||
| March 2012 | 22.89 | 168,547 | 5,975 | 162,572 | Not yet vested | |||
| March 2014 | 22.89 | 8,614 | -1,000 | 9,614 | Not yet vested | |||
| March 2013 | 26.00 | 184,612 | 3,650 | 180,962 | Not yet vested | |||
| March 2015 | 26.00 | 172,440 | 3,341 | 169,099 | Not yet vested | |||
| March 2014 | 8.31 | 162,199 | 162,199 | Not yet vested | ||||
| March 2016 | 8.31 | 7,533 | 7,533 | Not yet vested | ||||
| Total | 1,094,654 | 306,884 | – | 58,517 | 1,343,021 |
* Only becoming vested on condition of uninterrupted employment.
Shares awarded
The following statement presents the position with regard to the numbers of shares awarded to existing and former members of the Managing Board.
| Date of award | Outstanding as at 31-12- 2008 | Conditionally awarded | Exercised | Expired | Outstanding as at 31-12-2009 | Status | |
| Managing Board | |||||||
| A.A. Röell | March 2005 | 1,430 | 1,430 | Vested | |||
| March 2006 | 1,292 | 1,292 | Not yet vested | ||||
| January 2007 | 3,897 | 3,897 | Not yet vested | ||||
| January 2008 | 3,500 | 3,500 | Not yet vested | ||||
| January 2009 | – | 8,838 | 8,838 | Not yet vested | |||
| N.E. Blom | March 2006 | 755 | 755 | Not yet vested | |||
| January 2007 | 1,823 | 1,823 | Not yet vested | ||||
| January 2008 | 1,800 | 1,800 | Not yet vested | ||||
| January 2009 | – | 4,545 | 4,545 | Not yet vested | |||
| S.A.J. van Katwijk | January 2009 | – | 2,105 | 2,105 | Not yet vested | ||
| R.J. Kooijman | January 2009 | – | 5,050 | 5,050 | Not yet vested | ||
| Former Managing Board members | |||||||
| March 2005 | 1,085 | 1,085 | Vested | ||||
| March 2006 | 890 | 890 | Not yet vested | ||||
| January 2007 | 2,147 | 2,147 | Not yet vested | ||||
| Total | 18,619 | 20,538 | — | 39,157 |
Exercise of options
No options were exercised in 2009.
52. Related parties
Parties are related if one controls the other or has significant influence on its financial and operating policies. In the case of KAS BANK, related parties are the members of the Managing Board, the members of the Supervisory Board and the pension fund Stichting Pensioenfonds KAS BANK.
| Remuneration of the Managing Board (in thousands of euros) 2009 |
Basic pay | Short-term variable remuneration | Pension contributions | Other remuneration | Value of shares granted | Value of shares granted | Total |
| A.A. Röell | 350 | 169 | 87 | 29 | 114 | 71 | 820 |
| R.J. Kooijman | |||||||
| (as from 1-1-2009) | 250 | 100 | 62 | 22 | 1641 | 41 | 639 |
| N.E. Blom | 225 | 82 | 56 | 21 | 59 | 37 | 479 |
| H. Kadiks (until 31-8-2009) | 135 | 125 | – | 1 | 261 | ||
| S.A.J. van Katwijk | |||||||
| (as from 1-7-2009) | 125 | 45 | 31 | 26 | 31 | 17 | 275 |
| Total | 1,085 | 521 | 236 | 99 | 368 | 166 | 2,474 |
1 This element of remuneration includes a token bonus in the form of options because of the loss of remuneration in the form of options from Mr. Kooijman’s former employer. The award of these options was not subject to any performance criteria.
| Remuneration of the Managing Board (in thousands of euros) 2008 |
Basic pay | Short-term variable remuneration | Pension contributions | Other remuneration | Value of shares granted | Value of shares granted | Total |
| A.A. Röell | 350 | – | 87 | 37 | 168 | 69 | 711 |
| J.S.A. van Scheijndel (until 31-8- 2008) | 149 | – | 49 | 6052 | – | – | 803 |
| N.E. Blom | 225 | – | 56 | 26 | 87 | 36 | 430 |
| H. Kadiks | 203 | – | – | 801 | – | – | 283 |
| Total | 927 | – | 192 | 748 | 255 | 105 | 2,227 |
1 This remuneration element is by way of compensation for the fact that Mr. Kadiks does not receive any long-term variable remuneration. The obligation arose in 2008 and was paid out in 2009.
2 This concerns the termination package for Mr. Van Scheijndel. In 2007, an amount of €700,000 was set aside for this purpose, part of this sum being accounted for in the fixed remuneration.
3 In connection with the result for 2008, the conditionally awarded options and shares are not expected to become vested.
Basic pay
This comprises salary payments.
Variable remuneration
This remuneration is set by the Supervisory Board on the basis of a proposal made by the Remuneration and Appointments Committee. Within the variable remuneration package, a distinction is made between short-term and long-term benefits.
The short-term benefits are based on the results and depend on the achievement of qualitative and quantitative targets for the year. This concerns the variable remuneration paid in cash for the year.
The long-term benefits are linked to the average growth in earnings per share over a period of three years and are paid in the form of shares and options.
Pension contributions
This item comprises the pension charges recognised in the income statement for the members of the Managing Boa rd.
Other remuneration
This item comprises the costs of commutation arrangements, long-service awards, non-activity arrangements, contribution to mortgage costs, lease costs and employer’s contributions.
Value of options and shares granted
This concerns the value of the stock options and shares granted by the Supervisory Board in respect of the year, on the basis of target performance (see note 51).
Two active members of the Managing Board, A.A. Röell and N.E. Blom, hold 1,430 respectively 400 depositary receipts for shares of the company.
| Proceeds from exercised options | Exercise price | Share price | Number | Result |
| 2009 | ||||
| None exercised | ||||
| 2008 | ||||
| J.S.A. van Scheijndel | 14.35 | 25.85 | 5,000 | 57,497 |
| N.E. Blom | 14.35 | 25.85 | 550 | 6,320 |
Under the terms of his termination package, the rights attaching to shares and options awarded to Mr. Van Scheijndel under the scheme in force up to 31 December 2006 remain intact. The options and shares awarded under the scheme applicable with effect from 1 January 2007 will be fixed at target performance unless the figure works out at less than 100% in 2010. In a latter event, Mr. Van Scheijndel will receive the same lower percentage as the other members of the Managing Board.
Loans
No loans, advances or guarantees have been granted to the active members of the Managing Board (2008: none). If the bank’s lending facilities are utilised by members of the Managing Board, the same terms apply as to other employees. These terms are in line with the market.
53. Remuneration of the Supervisory Board
The number of members of the Supervisory Board as at year-end 2009 was six (2008: six). The following remuneration was received by the members of the Supervisory Board, including fees for membership of subcommittees formed by the Supervisory Board and VAT (in thousands of euros).
| (in thousands of euros) | 2009 | 2008 |
| D.J.M.G. Baron van Slingelandt | 44 | 42 |
| C. Griffioen | 33 | 33 |
| A.H. Lundqvist | 37 | 35 |
| R.A.H. van der Meer | 37 | 37 |
| H. Donkervoort | 32 | 36 |
| J.M.G. Frijns (as from 23-04-2008) | 37 | 26 |
| P. Ribourdouille (up to 23-04-2008) | – | 14 |
| Total | 220 | 223 |
The total amount of loans advanced to and guarantees given on behalf of members of the Supervisory Board was nil (2008: nil).
54. Auditors‘ fees
The following table presents the costs recognised in the income statement in respect of KAS BANK’s external auditors KPMG Accountants N.V. for services rendered.
| (in thousands of euros) | 2009 | 2008 |
| KPMG Accountants N.V. | ||
| Audit of the financial statements | 542 | 515 |
| Other audit assignments | 32 | 64 |
| Other KPMG departments: | ||
| Tax consultancy | 32 | 88 |
| Other non-audit assignments | 313 | 389 |
| Total | 919 | 1,056 |
The above amounts include VAT which is not recoverable amounting to €109,000 (2008: €176,000).
| (in thousands of euros) | 2009 | 2008 | ||
| Income | ||||
| Interest income | 86,840 | 311,040 | ||
| Interest expense | 56,401 | 282,372 | ||
| Net interest | 30,439 | 28,668 | ||
| Commission income | 85,563 | 104,559 | ||
| Commission expense | 14,960 | 16,804 | ||
| Net commission | 70,603 | 87,755 | ||
| Results of subsidiaries | -372 | -6,616 | ||
| Investments at fair value through profit or loss | 12,789 | 9,071 | ||
| Available-for-sale investments | 16,112 | 1,888 | ||
| Result on investments | 28,901 | 10,959 | ||
| Other income | 1,895 | 572 | ||
| Total income | 131,466 | 121,338 | ||
| Operating expenses | ||||
| Staff costs | 65,038 | 68,859 | ||
| Other administrative expenses | 29,350 | 29,063 | ||
| Depreciation/amortisation | 4,830 | 7,473 | ||
| Operating expenses | 99,218 | 105,395 | ||
| Impairment losses | -271 | 67,184 | ||
| Total operating expenses | 98,947 | 172,579 | ||
| Result for the period before tax | 32,519 | -51,241 | ||
| Tax expenses | 7,938 | -11,308 | ||
| Result for the period | 24,581 | -39,933 |
| (in thousands of euros) | 31-12-2009 | 31-12-2008 |
| Assets | ||
| Cash and deposits at the central bank | 469,339 | 1,247,447 |
| Banks | 2,696,073 | 1,691,618 |
| Loans and advances | 903,836 | 2,441,312 |
| Reverse repurchase agreements | 584,346 | 732,641 |
| Derivative financial instruments | 92,141 | 386,095 |
| Investments at fair value through profit or loss | ||
| • Investments held for trading | – | 5,583 |
| • Investments classified as assets measured at fair value through profit or loss | 154,630 | 26,893 |
| Available-for-sale investments | 1,286,782 | 678,891 |
| Current tax assets | 25,995 | 35,570 |
| Other assets | 16,973 | 23,921 |
| Prepayments and accrued income | 12,749 | 19,134 |
| Financial assets | 135,637 | 43,832 |
| Property and equipment | 2,286 | 50,531 |
| Intangible assets | 7,376 | 7,688 |
| Deferred tax assets | 2,762 | 2,420 |
| Total assets | 6,390,925 | 7,393,576 |
| Equity and liabilities | ||
| Ba n ks | 2,328,136 | 1,217,131 |
| Funds entrusted | 3,722,370 | 5,563,024 |
| Derivative financial instruments | 116,144 | 395,689 |
| Current tax liabilities | 1,354 | 1,233 |
| Other liabilities | 4,548 | 10,026 |
| Accruals and deferred income | 14,316 | 26,381 |
| Provisions | 740 | 906 |
| Deferred tax liabilities | 6,187 | 8,623 |
| Employee benefits | 3,762 | 3,055 |
| Total liabilities | 6,197,557 | 7,226,068 |
| Share capital | 15,699 | 15,699 |
| Share premium | 21,569 | 21,569 |
| Revaluation reserve | 27,688 | 19,937 |
| Statutory reserve | 4,405 | 4,827 |
| Other reserves | 104,235 | 145,409 |
| Unappropriated result | 19,772 | -39,933 |
| Total equity attributable to the equity holders of the bank | 193,368 | 167,508 |
| Total equity and liabilities | 6,390,925 | 7,393,576 |
| Contingent liabilities | 30,844 | 84,615 |
| Irrevocable facilities | 62,816 | 58,021 |
Summary of accounting policies
The company financial statements have been prepared in accordance with Part 9 of Book 2 of the Netherlands Civil Code, applying the same accounting policies as for the consolidated financial statements, as provided by Section 362: 8 of Part 9 of Book 2 of the Netherlands Civil Code except for those relating to financial assets and the statutory reserve.
The financial statements are presented in thousands of euros, unless stated otherwise. The amounts presented in the tables have been computed using figures which have not been rounded and it is therefore possible for differences to occur due to the effects of rounding. The euro is also KAS BANK’s functional currency.
To facilitate comparison, the comparative figures have been restated where necessary.
Where applicable, reference is made to the notes to the consolidated financial statements. Differences relate to the consolidation of the subsidiaries.
Financial assets
The consolidated subsidiaries and associates in respect of which KAS BANK has significant influence on financial and operating policy decisions are carried in the company financial statements at KAS BANK’s share in their net asset value, calculated in accordance with KAS BANK’s accounting policies. The share in the results of subsidiaries is presented in the income statement under the heading ‚results of subsidiaries‘.
| Financial assets (in thousands of euros) | Group companies | Receivables from group companies | Total |
| Position as at 1 January 2009 | 25,178 | 18,654 | 43,832 |
| Loan | – | -9,442 | -9,442 |
| Payment of profit for previous year | – | – | – |
| Result for the period | -372 | – | -372 |
| Purchases | 87,397 | – | 87,397 |
| Revaluation, gross | 14,222 | – | 14,222 |
| Position as at 31 December 2009 | 126,425 | 9,212 | 135,637 |
As at 31 December 2009, the subsidiaries include:
| – Amsterdam Depositary Company N.V. | Amsterdam |
| – KAS Derivaten Clearing N.V. | Amsterdam |
| – KAS Fondsbeheer B.V. | Amsterdam |
| – KAS BANK Effectenbewaarbedrijf N.V. | Amsterdam |
| – KAS Trust B.V. | Amsterdam |
| – KAS Servicing B.V. | Amsterdam |
| – KAS Participatiemaatschappij B.V. | Amsterdam |
| – Centrum voor Fondsenadministratie B.V. | Amsterdam |
| – Addition Knowledge House B.V. | Amsterdam |
| – KAS BANK OG Spuistraat B.V. (with effect from 1 January 2009) | Amsterdam |
| – KAS BANK OG NZVW B.V. (with effect from 1 January 2009) | Amsterdam |
| – KAS Europe BVBA (with effect from 19 May 2008) | Brussels |
| – KB Deutschland Holding GmbH (with effect from 16 May 2008) | Wiesbaden |
| o KAS Investment Servicing GmbH (with effect from 1 July 2008) | Wiesbaden |
A complete list of subsidiaries has been deposited with the Trade Register of the Amsterdam Chamber of Commerce. Apart from an interest of 50% plus one share in Addition Knowledge House B.V., KAS BANK’s interest in all the subsidiaries is 100%.
Property and equipment and revaluation reserve
In 2009, KAS BANK N.V. transferred its premises in Amsterdam together with associated assets to two separate private limited liability companies, KAS BANK OG Spuistraat B.V. and KAS BANK OG NZVW B.V. the revaluation reserve related to these premises was also transferred.
Statutory reserve
The Statutory reserve is built up from the other reserves and concerns capitalised in-house developed software.
Repurchase of own shares
The company’s shares which have been repurchased have been deducted from other reserves in the company financial statements.
Off-balance-sheet financial commitments
Pursuant to Section 403, subsection 1.f, of Part 9, Book 2, of the Netherlands Civil Code, the company has assumed joint and several liability for debts arising out of the legal acts of the above subsidiaries apart from Addition Knowledge House B.V., KAS Europe BVBA and KB Deutschland Holding GmbH. KAS BANK has also allocated €5.0 million internally in connection with the establishment of a stock deposit bank within KAS BANK’s German branch to cover possible liabilities of the stock deposit bank.
Tax
The abovementioned companies form part of the KAS BANK tax group for corporation tax, except for Amsterdam Depositary Company N.V., KAS Derivaten Clearing N.V., KAS BANK Effectenbewaarbedrijf N.V., Addition Knowledge House B.V., KAS Europe BVBA, KB Deutschland Holding GmbH and KAS Investment Servicing GmbH. The VAT tax group comprises KAS BANK N.V., KAS Derivaten Clearing N.V., Knowledge House B.V., KAS BANK OG Spuistraat B.V. and KAS BANK OG NZVW B.V.
KAS BANK is jointly and severally liable for the tax liabilities of the tax group as a whole.
Related parties
Both the sale of the premises to KAS BANK OG Spuistraat B.V and KAS BANK OG NZVW B.V and the rental contracts between KAS BANK N.V. and the private limited liability companies now owning the properties were concluded on market terms and conditions.
Management declaration
KAS BANK’s Managing Board and Supervisory Board hereby declare that the financial statements give a true and fair view of the assets, liabilities, financial position and profit or loss of the issuing institution and the companies included in the consolidation.
Amsterdam, 3 March 2010
KAS BANK Managing Board and Supervisory Board
Management Board
A.A. Röell
R.J. Kooijman
N.E. Blom
S.A.J. van Katwijk
Supervisory Board
A.A. Röell
R.J. Kooijman
N.E. Blom
S.A.J. van Katwijk
Other information
Appropriation of result for 2009
The provisions of Articles of Association concerning the appropriation of profit read as follows:
Article 25 – Distributions, reserves, losses
| 1. |
The company may pay dividends and make distributions to shareholders and others with entitlement to the distributable profit only insofar as its shareholders‘ equity exceeds the amount of the paid and called capital together with the reserves which the company is required to maintain by law. |
| 2. |
Out of the profit for the preceding financial year, a dividend will if possible first be paid on the preference shares of a percentage of the amount paid on those shares, said percentage being related to the average yield on the five longest-dated government loans, calculated in the manner set forth below. The percentage dividend payable on the preference shares will be calculated by taking the arithmetic mean of the average effective yield of the loans referred to above, as computed by the Central Bureau of Statistics and published in the Official Price List of NYSE Euronext Amsterdam N.V., calculated over the first twenty trading days of the twenty-two trading days prior to the date of first issue of preference shares, plus a percentage of a maximum of one-half percentage point, to be determined by the Managing Board and approved by the Supervisory Board, with reference to the prevailing market conditions. If and to the extent that the profit is not sufficient to pay the dividend referred to in this paragraph in full, the deficit will be made good by a charge on the reserves. |
| 3. |
In the event of cancellation and repayment of preference shares, a payment shall be made on the cancelled preference shares, calculated as far as possible in accordance with the provisions of paragraph 2 and paragraph 4, proportionately over the period from the date on which a payment referred to in paragraph 2 and paragraph 4 was last made Ð or, if the preference shares were issued after that date, from the date of issue Ð up to the date of repayment. |
| 4. |
If in any financial year the profit or the distributable reserves are not sufficient to make the distributions referred to in this article, the provisions of the first two sentences of paragraph 2 and the provisions of paragraphs 5 and 6 will not apply until the deficit has been made up. |
| 5. |
The Managing Board, with the prior approval of the Supervisory Board, is empowered to appropriate all or part of the profit to reserves |
| 6. |
Any profit remaining after the deduction of an appropriation to reserves as referred to in the preceding paragraphs will be at the disposal of the General Meeting. If the General Meeting resolves to pay a dividend, it will be paid to the holders of ordinary shares in proportion to their holdings of ordinary shares. |
| 7. |
Insofar as the General Meeting resolves not to pay a dividend in respect of any year, the profit will be added to the reserves. |
| 8. |
The Managing Board may, with the approval of the Supervisory Board, resolve to pay an interim dividend, provided that the requirements of paragraphs 1 and 13 of the present Article have been met. The provisions of paragraph 10 of the present Article will be applicable mutatis mutandis to the payment of the interim dividend. |
| 9. |
The General Meeting may resolve, only on a proposal of the Managing Board as approved by the Supervisory Board, to pay a dividend from a distributable reserve. |
| 10. |
Without prejudice to the provisions of Article 4 of the present Articles of Association, the General Meeting may resolve, on a proposal of the Managing Board as approved by the Supervisory Board, to pay a dividend from the profit Ð or from a distributable reserve Ð in the form of shares in the company or depositary receipts therefore. |
| 11. |
Dividends will be payable at such place and at such time as the M anaging Board may determine, but at the latest within one month of the resolution adopted by the General Meeting to that effect. Payment of dividend will be announced to the shareholders by letter and by means of an advertisement placed in a national daily newspaper and in the Official Price List of NYSE Euronext Amsterdam N.V. |
| 12. |
Dividends which have not been taken up within five years of the date on which they became payable will revert to the company. |
| 13. |
Interim distributions will be made in accordance with Section 105, subsection 4, of Book 2 of the Netherlands Civil Code |
Proposed appropriation of result for 2009
The Managing Board, with the approval of the Supervisory Board, proposes that the General Meeting of Shareholders approve the following appropriation of the result:
| Appropriation of the result according to the consolidated income statement for 2009 (in thousands of euros) |
|
| Result for the period | 24,581 |
| Interim dividend | -4,809 |
| Proposed final dividend | -5,829 |
| Proposed addition to other reserves | 13,943 |
Based on the result for 2009, the General Meeting of Shareholders will be invited to declare a dividend of €0.73 per share. Taking account of the interim dividend for 2009 amounting to €0.33 per share, the final dividend will amount to €0.40 per share. The dividend distribution chargeable to the result thus amounts to €10.6 million, of which €4.8 million has already been distributed as interim dividend.
Auditors‘ report
To the General Meeting of Shareholders of KAS BANK N.V.
Report on the financial statements
We have audited the 2009 financial statements of KAS BANK N.V., Amsterdam, as presented on pages 37 to 113 of this annual report. These financial statements consist of the consolidated financial statements and the company financial statements. The consolidated financial statements comprise the consolidated balance sheet as at 31 December 2009, the consolidated income statement, the consolidated statement of comprehensive income, the consolidated statement of changes in equity and the consolidated cash flow statement for the year then ended, and a summary of significant accounting policies and other explanatory notes. The company financial statements comprise the company balance sheet as at 31 December 2009, the company income statement for the year then ended and the notes.
Management’s responsibility
Management is responsible for the preparation and fair presentation of the financial statements in accordance with International Financial Reporting Standards as adopted by the European Union and with Part 9 of Book 2 of the Netherlands Civil Code and for the preparation of the directors‘ report in accordance with Part 9 of Book 2
of the Netherlands Civil Code. This responsibility includes designing, implementing and maintaining internal controls relevant to the preparation and fair presentation of financial statements that are free from material misstatement, whether due to fraud or error, selecting and applying appropriate accounting policies and making accounting estimates that are reasonable in the circumstances.
Auditors‘ responsibility
Our responsibility is to express an opinion on the financial statements based on our audit. We conducted our audit in accordance with Dutch law. The law requires that we comply with ethical requirements and plan and perform the audit to obtain reasonable assurance that the financial statements are free from material misstatement. An audit involves performing procedures to obtain audit evidence about the amounts and disclosures in the financial statements. The procedures selected depend on the auditors‘ judgment, including the assessment of the risks of material misstatement of the financial statements, whether due to fraud or error. In making those risk assessments, the auditors consider internal controls relevant to the entity’s preparation and fair presentation of the financial statements in order to design audit procedures that are appropriate in the circumstances but not for the purpose of expressing an opinion on the effectiveness of the entity’s internal control. An audit also includes evaluating the appropriateness of accounting policies used and the reasonableness of accounting estimates made by management, as well as evaluating the overall presentation of the financial statements.
We believe that the audit evidence we have obtained is sufficient and appropriate to provide a basis for our audit opinion.
Opinion with respect to the consolidated financial statements
In our opinion, the consolidated financial statements give a true and fair view of the financial position of KAS BANK N.V. as at 31 December 2009 and of its result and its cash flow for the year then ended in accordance with International Financial Reporting Standards as adopted by the European Union and with Part 9 of Book 2 of the Netherlands Civil Code.
Opinion with respect to the company financial statements
In our opinion, the company financial statements give a true and fair view of the financial position of KAS BANK N.V. as at 31 December 2009 and of its result for the year then ended in accordance with Part 9 of Book 2 of the Netherlands Civil Code.
Report on other legal and regulatory requirements
Pursuant to the legal requirement under 2:393 sub 5 part f of the Netherlands Civil Code, we report, to the extent of our competence, that the directors‘ report is consistent with the financial statements as required by 2:391 sub 4 of the Netherlands Civil Code.
Amsterdam, 3 March 2010
KPMG ACCOUNTANTS N.V.
M.A. Hogeboom
Report of Stichting Administratiekantoor Aandelen KAS BANK (KAS BANK Registrar’s office)
Stichting Administratiekantoor Aandelen KAS BANK (KAS BANK Registrar’s Office) administers and manages a substantial proportion of the ordinary shares in the issued capital of KAS BANK N.V. and, with the cooperation of the company, issues in exchange depositary receipts with limited exchangeability. The Registrar’s Office itself exercises voting rights only in respect of shares for which no proxies have been granted to the depositary receipt holders and shares for which no voting instructions have been received. This arrangement is conducive to the continuity of decision-making within the General Meeting of Shareholders and preserves the balance of the meeting by preventing a chance minority of those entitled to exercise voting rights influencing the decisionmaking process of the Meeting of Shareholders.
The Executive Committee hereby reports on its activities in the financial year in accordance with Article 18 of its Administration Conditions.
The Executive Committee met once in 2009 at the company’s offices. The members of the Executive Committee also kept in touch during the year by telephone, letter and e-mail. The Executive Committee was also represented in the General Meeting of Shareholders held on 22 April 2009.
The main business of the meeting concerned the recent developments in the field of corporate governance, the Maas Committee report (‚Towards restoration of confidence‘), the articles of association of the Registrar’s Office and the proposed change in the Administration Conditions. Having also taken cognisance of the agenda for the General Meeting of Shareholders on 22 April 2009 and the resolutions tabled by the Managing Board and Supervisory Board included therein, the Executive Committee put questions to the Managing Board of the company and was given further information on some of the items. Based on this information and having regard to the interests of the holders of depositary receipts, along with the interests of the company, its related enterprise and all stakeholders, the Registrar’s Office decided to vote in favour of all the resolutions on the agenda. The Registrar’s Office did not seek external advice.
For the General Meeting of Shareholders on 22 April 2009, the Registrar’s Office issued proxies to 35 depositary receipt holders and/or their proxies, compared with 52 in 2008. The Registrar’s Office received voting instructions from three depositary receipt holders. The shareholders and depositary receipt holders attending the meeting represented approximately 66.0% of the voting shares at the meeting and the Registrar’s Office thus represented 34% of the voting shares.
The total number of ordinary shares in the issued capital of the company remained unchanged in 2009 at 15,699,017. As at year-end 2009, the Registrar’s Office had 15,616,019 ordinary shares under administration, in exchange for which the same number of depositary receipts had been issued. Depositary receipts have been issued for approximately 99.5% of the total issued share capital. The increase in the number of shares under administration by the Registrar’s Office compared with year-end 2008 (around 94%) was due to the exchange of registered shares for depositary receipts by several shareholders.
The actual administrative procedures are performed by the company. The expenses of the Registrar’s Office in 2009, which amounted to approximately €20.000, related mainly to the remuneration of the members of the Executive Committee and the contribution to Centrum voor Fondsenadministratie. The company has undertaken to make an annual sum available to the Registrar’s Office from which it can defray its expenses.
Mr. H. Zwarts was due to retire from the Executive Committee by rotation in 2009 and was reappointed by the Committee for a term of three years with effect from 1 July 2009. Mr. Tesselhoff is due to retire by rotation in 2010 and Mr. Baan is due to retire by rotation in 2011.
The members of the Executive Committee receive an annual fee of €6,000 for their services to the Registrar’s Office. The members of the Executive Committee who are designated as independent are not persons associated with the company within the meaning of Article 4, paragraph 1, of the Constitution of the Registrar’s Office. A list of the positions held by the members of the Executive Committee of the Registrar’s Office is available for inspection at the company’s office and on the dedicated website of the Registrar’s Office (www.stichtingadministratiekantoor. kasbank.com).
Amsterdam, 2 February 2010
The Executive Committee:
A. Baan, chairman (2011)
Chr.H. Tesselhoff (2010)
H. Zwarts (2012)
Report of Stichting Administratiekantoor Aandelen KAS BANK Effectenbewaarbedrijf (KDTC Registrar’s Office)
Stichting Administratiekantoor Aandelen KAS BANK Effectenbewaarbedrijf (‚KDTC Registrar’s Office‘) holds all the shares in KAS BANK Effectenbewaarbedrijf N.V. (KAS BANK Depositary Trust Company or KDTC), in exchange for which it has issued non-exchangeable depositary receipts for shares to KAS BANK N.V. KDTC acts on KAS BANK’s behalf as a custodian of securities for KAS BANK’s clients, to the extent that such securities would be counted as KAS BANK’s assets by virtue of KAS BANK’s custody thereof. KDTC’s object expressly excludes the conduct of any business other than the custody of securities which involves commercial risk. Custody is provided by KDTC subject to the ‚Terms concerning custody of securities‘, in which KAS BANK guarantees to its clients the due performance of all of KDTC’s obligations to them. The activities associated wit custody operations are performed by KAS BANK, which also acts as the Management of KDTC. Changes and additions may be made to the aforementioned Terms by KAS BANK and KDTC acting together, provided that the prior approval of KDTC Registrar’s Office is obtained. The Constitution of KDTC Registrar’s Office stipulates that at least half of the members of the Executive Committee must be persons who are not employed by KAS BANK or any institution associated with it. This requirement is met.
The Executive Committee of KDTC Registrar’s Office met on 4 February 2010 to consider KDTC’s 2009 financial statements. The Executive Committee also received a report that the auditors had determined that, as to thei design and existence, the arrangements made by KAS BANK with regard to the segregation of assets complied with the relevant regulations. After approval and adoption of the financial statements, the General Meeting of Shareholders of KDTC discharged the Management of the company of liability for its conduct of affairs in 2009.
In 2009 it was the turn of Mr. R.P. Voogd to step down as member of the Executive Committee. With the approval of KAS BANK’s Supervisory Board, Mr. Voogd was reappointed by the Executive Committee.
Mr. R.J. Kooijman, member of the Managing Board of KAS BANK, was appointed member of the Executive Committee of the KDTC Registrar’s Office with effect from 1 July 2009. In 2010 it was the turn of Mr. Kooijman to step down as member of the Executive Committee. Subject to the approval of KAS BANK’s Supervisory Board, Mr. Kooijman has been reappointed by the Executive Committee.
Amsterdam, 4 February 2010
The Executive Committee:
D.H. Cross, chairman (2011)
R.P. Voogd (2012)
R.J. Kooijman (2010)
Report of Stichting Administratiekantoor Aandelen KAS BANK Derivaten Clearing (KASDC Registrar’s Office)
Stichting Administratiekantoor Aandelen KAS Derivaten Clearing (‚KASDC Registrar’s Office‘) holds all the shares in KAS Derivaten Clearing N.V. (‚KASDC‘), in exchange for which it has issued non-exchangeable depositary receipts for shares to KAS BANK N.V. KASDC acts on KAS BANK’s behalf as clearing member and holder of derivatives positions for KAS BANK’s clients. KASDC’s object expressly excludes the conduct of any other business which involves commercial risk. KASDC holds derivatives positions for clients subject to the ‚Terms concerning the holding of derivatives‘ in which KAS BANK guarantees to its clients the due performance of all of KASDC’s obligations to them. The positions are administered by KAS BANK, which also acted until 1 September 2007 as sole member of the Executive Committee of KASDC. Changes and additions may be made to the aforementioned Terms by KAS BANK and KASDC acting together, provided that the prior approval of KASDC Registrar’s Office is obtained. The Constitution of KASDC Registrar’s Office stipulates that at least half of the members of the Executive Committee must be persons who are not employed by KAS BANK or any institution associated with it. This requirement is met.
The Executive Committee of KASDC Registrar’s Office met on 4 February 2010 to consider KASDC’s 2009 financial statements. The Executive Committee also received a report that the auditors had determined that, as to their design and existence, the arrangements made by KAS BANK with regard to the segregation of assets complied with the relevant regulations. After approval and adoption of the financial statements, the General Meeting of Shareholders of KDSC discharged the Management of the company of liability for its conduct of affairs in 2009.
In 2009 it was the turn of Mr. R.P. Voogd to step down as member of the Executive Committee. With the approval of KAS BANK’s Supervisory Board, Mr. Voogd was reappointed by the Executive Committee. Mr. R.J. Kooijman, member of the Managing Board of KAS BANK, was appointed member of the Executive Committee of the KASDC Registrar’s Office with effect from 1 July 2009. In 2010 it was the turn of Mr. Kooijman to step down as member of the Executive Committee. Subject to the approval of KAS BANK’s Supervisory Board, Mr. Kooijman has been reappointed by the Executive Committee.
Amsterdam, 4 February 2010
The Executive Committee:
D.H. Cross, chairman (2011)
R.P. Voogd (2012)
R.J. Kooijman (2010)
Corporate governance
The revised Dutch corporate governance code produced by the Frijns Committee came into operation on 1 January 2009. The corporate governance code contains principles and best-practice provisions to be observed by managing boards, supervisory boards and shareholders of listed companies in the Netherlands vis-ä-vis each other. This concerns rules with respect to modern, widely supported and generally held views on good corporate governance. In addition, the Banking Code, issued by the Netherlands Bankers‘ Association, came into operation on 1 January 2010. The Banking Code mainly relates to the functioning of managing boards and supervisory boards in a specifically banking context, with risk management receiving particular attention. The present section of the report covers compliance with the corporate governance code and the Banking Code and the main elements of KAS BANK’s corporate governance structure.
Given below is a summary of the recent developments in the field of corporate governance affecting the company. This is followed by an outline of KAS BANK’s corporate governance structure, explaining its system of management by the Managing Board, supervision of management by the Supervisory Board, reporting to capital providers on the management and supervision of the management and the powers vested in the capital providers. The remuneration policy, the capital structure and the financial reporting are also explained. This exposition is based inter alia on the Articles of Association as formulated since 6 June 2006.
Recent developments
Dutch corporate governance code
On 10 December 2008, the corporate governance code Monitoring Committee (Frijns Committee) presented the updated Dutch corporate governance code. The corporate governance code was designated as the official code of conduct to be adhered to by Dutch listed companies with effect from 1 January 2010. The main changes compared with the previous Code dating from December 2004 concerned the remuneration of managing board members, risk management, the responsibilities of shareholders and diversity in the composition of supervisory boards. The corporate governance code was published in the Official Gazette of 3 December 2009, no. 18499 and can also be found on www.commissiecorporategovernance.nl.
In 2009, the company took the necessary steps to apply the corporate governance code with effect from 1 January 2010. The Dutch corporate governance code and the Banking Code were analysed and discussed with the Supervisory Board. Other risk management measures and the approach to risk management within KAS BANK were discussed, changes in the remuneration policy for the Managing Board were prepared and the remuneration policy for the bank as a whole was reviewed.
KAS BANK has annotated the text of the corporate governance code, either confirming the company’s compliance or explaining its non-compliance with each of the best-practice provisions in turn. KAS BANK will be applying almost all of the best-practice provisions, giving an explanation of non-compliance in the case of two provisions only. This concerns best-practice provision II.1.1 (the existing members of KAS BANK’s Managing Board have been appointed indefinitely) and III.5.10/14 (KAS BANK has a combined Appointments and Remuneration Committee).
A comprehensive explanation of the corporate governance code can be found on the company’s website. The Banking Code will be discussed with the shareholders at the forthcoming General Meeting of Shareholders to be held on 21 April 2010.
Banking Code
The Banking Code came into operation on 1 January 2010. The Banking Code was adopted by the Netherlands Bankers‘ Association on the basis of the report by the Advisory Committee on the Future of Banking (‚Towards restoration of confidence‘). It contains principles which go further than those contained in the Dutch corporate governance code. The Banking Code focuses particularly on the role of the managing board and the supervisory board of a bank and the function of risk management and of auditing within a bank. The Banking Code also contains principles relating to a moderated remuneration policy. Additionally, it contains principles for permanent education for members of managing boards and supervisory boards and an ethical declaration for bankers. The Banking Code is expected to acquire the same statutory basis as the corporate governance code. The Banking Code can be found on the website of the Netherlands Bankers‘ Association (www.nvb.nl).
In 2009, the company took the necessary steps to apply the Banking Code with effect from 1 January 2010. The Banking Code was analysed and discussed with the Supervisory Board. The approach to risk management within KAS BANK, the aim of risk management and the steps required in order to put in place an effective risk management organisation were discussed with the Supervisory Board and generally tightened up within the bank. The bank’s acceptance of risk (risk appetite) was discussed with the Supervisory Board and received the Board’s endorsement. The mandate of the Risk Management Committee was strengthened to reflect the requirements of the Banking Code and the bank’s remuneration policy was reviewed for undesirable incentives which might increase the appetite for risk. In 2009, a start was made with the preparation of a new remuneration policy for the Managing Board, taking its cue from the provisions of the Banking Code amongst other considerations.
KAS BANK has annotated the text of the Banking Code, either confirming the company’s compliance or explaining its non-compliance with each of the best-practice provisions in turn. In fact, KAS BANK will be complying with all the principles. The annotated code can be found on the company’s website (www.kasbank.com). The Banking Code will be discussed with the shareholders in the forthcoming General Meeting of Shareholders to be held on 21 April 2010.
The main changes within the company prompted by the corporate governance code and the Banking Code are briefly covered below:
| • |
Greater emphasis on risk management: Further tightening up of risk management within the bank by means of the intensive risk management programme embarked upon at the end of 2008, the progress of which was discussed in each of the meetings of the Supervisory Board, comprehensive description of the setup and operation of the internal risk management and control systems and the appointment of a Chief Risk Officer. |
| • |
Reaffirmation of the fact that KAS BANK seeks a low-risk profile. This is reflected in the risk management of all relevant parts of the bank. The company’s risk appetite was explicitly discussed in the meetings of the Supervisory Board in 2009 and received the Supervisory Board’s endorsement. |
| • |
Changes to the remuneration policy for the Managing Board in line with the corporate governance code and the Banking Code, which will be put before the shareholders for approval in 2010. The underlying principles of the new policy are that the total income should be slightly below the median for comparable positions (yet to be decided) and that the variable remuneration element should not exceed 100% of the annual fixed pay. |
| • |
The new Managing Board remuneration policy includes a scenario analysis (analysis of possible outcomes for the variable component of the remuneration in different scenarios), scrutiny of the remuneration structure with respect to the attitude to risk on the part of Managing Board members (remuneration structure should not encourage Managing Board members to act in their own interests or to take risks that are not commensurate with the accepted strategy) and a claw-back clause (giving the Supervisory Board the power to demand repayment of variable remuneration that was awarded on the basis of incorrect financial and other information). |
| • |
A programme of permanent education for Supervisory Board members has been drawn up and will be further formalised. The programme will be included in the annual evaluation of the Supervisory Board. |
| • |
A programme of permanent education for the Managing Board members has been worked out and will be further formalised. This will be reported on in the 2010 Annual Report. |
| • |
An ethical declaration: the declaration proposed by the Maas Committee has been signed by all members of the Managing Board as it stands and has been posted on the company’s website. A version of this declaration to be signed by staff in general is in preparation. |
Several aspects are still being worked on, such as the code of conduct, the updating of the rules and the profile of the Supervisory Board.
Outlines of the corporate governance structure
Management Board
As a two-tier company (structuurvennootschap), KAS BANK is subject to the provisions of Title 4, Part 6, of Book 2 of the Netherlands Civil Code. The company is managed by a Managing Board consisting of two or more members. In the performance of its duties, the Managing Board is guided by the interests of the company and the enterprise associated therewith, weighing the interests of all stakeholders in the company. The procedures of the Managing Board are defined in the company’s Articles of Association and the by-laws of the Managing Board. The Articles of Association and by-laws of are posted on the company’s website.
Members of the Managing Board are appointed and may be removed by the Supervisory Board.
The Supervisory Board is required to notify the General Meeting of Shareholders of a proposal to appoint a member of the Managing Board. The Employees‘ Council is given an opportunity to state its position on a proposed resolution to appoint or dismiss a member of the company’s Managing Board. The General Meeting of Shareholders is consulted by the Supervisory Board on a proposal to dismiss a member of the Managing Board. Certain management decisions are subject to the prior approval of the Supervisory Board or the General Meeting of Shareholders.
The Managing Board has been authorised by the General Meeting of Shareholders to issue shares up to a maximum of 10% of the company’s issued share capital, including the granting of rights to acquire shares, and an additional 10% of the company’s issued share capital if the issue of this additional 10% is in connection with a merger or acquisition, subject to the approval of the Supervisory Board. The Managing Board has also been authorised by the General Meeting of Shareholders to repurchase the company’s own shares, subject to the approval of the Supervisory Board. The General Meeting of Shareholders is invited each year to renew these authorisations in respect of the numbers specified therein for a further period of 18 months.
Conflicts of interest of all kinds between the company and members of the Managing Board are avoided. The prior approval of the Supervisory Board is required for transactions involving conflicts of interest with members of the Managing Board which are of material significance for the company and/or the relevant members of the Managing Board. In the event of any conflict of interest arising between the company and members of the
Managing Board, the best-practice provisions (II.3.2-II.3.4) of the Code are applied. No conflicts of interest arose between the company and members of the Managing Board during the year under review.
Supervisory Board
The Supervisory Board of KAS BANK is charged with supervising the policy of the Managing Board, the general course of affairs within the company and the enterprise associated therewith. It also assists the Managing Board in an advisory capacity. In the event of the absence or inability to act of all the members of the Managing Board, the Supervisory Board is charged with the temporary management of the company. In the performance of their duties, the members of the Supervisory Board are guided by the interests of the company and the enterprises associated therewith, weighing the relevant interests of the stakeholders in the company. The procedures of the Supervisory
Board are defined in the company’s Articles of Association and the Supervisory Board’s by-laws. The Supervisory Board has also formulated a profile, which defines the Board’s ideal size and composition. The Supervisory Board is composed such that the members are able to operate independently of and adopt a critical stance with respect to one another, the Managing Board and any partial interests. The by-laws and profile of the Supervisory Board are posted on the company’s website.
Members of the Supervisory Board are appointed by the General Meeting of Shareholders on nomination by the Supervisory Board. The Managing Board, the General Meeting of Shareholders and the Employees‘ Council may nominate individuals for appointment to the Supervisory Board. The Employees‘ Council may object to an appointment proposed by the Supervisory Board. The Employees‘ Council has an enhanced right of recommendation with respect to the member of the Supervisory Board whose portfolio includes social policy.
Conflicts of interest of all kinds between the company and members of the Supervisory Board are avoided. The prior approval of the Supervisory Board is required for transactions involving conflicts of interest with members of the Supervisory Board which are of material significance for the company and/or the relevant members of the Supervisory Board. In the event of any conflict of interest arising between the company and members of the Supervisory Board, the best-practice provisions (III.6.1-III.6.4) of the Code are applied. No conflicts of interest arose between the company and members of the Supervisory Board during the year under review.
A member may be appointed to the Supervisory Board up to three times for a term of four years. Supervisory Board members retire at the age of 72. In certain instances (such as neglect of his or her duties or material changes in circumstances), a Supervisory Board member may be suspended or dismissed by the Enterprise Division of the Court of Amsterdam at the request of the Supervisory Board.
General Meeting of Shareholders
KAS BANK encourages full participation by the shareholders in decision-making at the General Meeting by actively inviting as many shareholders and depositary receipt holders as possible to attend and minimising the restrictions on voting rights. Subject to certain conditions, a holder of shares or depositary receipts representing one per cent (1%) of the issued capital can have an item placed on the agenda. The principle that shareholders have voting rights in the meeting and depositary receipt holders are only able to address the meeting is increasingly being abandoned. At least one General Meeting of Shareholders is held each year.
Depositary receipt holders attending the General Meeting of Shareholders in person or represented by a proxy are, if requested, granted unrestricted and unconditional voting rights automatically by KAS BANK Registrar’s Office (‚Registrar’s Office‘). This means that voting rights will also be granted in time of ‚war‘ (for example, if a hostile bid is imminent, if 25% or more of the issued share capital is held by one party or if the interests of the company are in jeopardy). Depositary receipt holders are free to vote as they see fit. They may also issue binding instructions to the Registrar’s Office to vote on their behalf.
The powers of the General Meeting of Shareholders are defined by law and the Articles of Association. Its principal powers are those of:
| • |
approving decisions that involve a material change in the identity or character of KAS BANK or its operations; |
| • |
adopting the remuneration policy and approving the share and option scheme for the Managing Board; |
| • |
approving the appointment and remuneration of members of the Supervisory Board; |
| • |
taking a vote of no confidence in the Supervisory Board; |
| • |
adopting the financial statements; |
| • |
appropriating the profit remaining after allocation to the reserves for distribution to the shareholders or addition to the reserves; |
| • |
discharging the Managing Board of liability for its management; |
| • |
discharging the Supervisory Board of liability for its supervision; |
| • |
authorising the Managing Board to issue and repurchase shares; |
| • |
resolving to amend the company’s Articles of Association, undertake a legal merger or demerger or wind up the company (on the joint proposal of the Managing Board and Supervisory Board). |
The company’s Articles of Association impose no restriction on the transfer of ordinary shares or depositary receipts for shares issued with the cooperation of the company or the exchange of depositary receipts for ordinary shares in the company.
Remuneration policy
The remuneration policy for the Managing Board is adopted by the General Meeting of Shareholders on a proposal of the Supervisory Board. Within the constraints of the adopted remuneration policy, the remuneration of the individual members of the Managing Board and the award of short-term and long-term variable remuneration are determined by the Supervisory Board on a proposal of the Appointments and Remuneration Committee. The remuneration report by the Supervisory Board describes how the remuneration policy has been applied in practice in the past financial year. The remuneration report, the principles of remuneration policy and the calculation of the various components of the salaries of the individual members of the Managing Board are included in the report of the Supervisory Board. The remuneration policy and the remuneration report are also posted on the company’s website.
Capital structure
The company’s share capital consists of ordinary shares and cumulative preference shares. All the shares are registered and no share certificates are issued. As at year-end 2009, there were 15,699,017 KAS BANK ordinary shares in issue (unchanged from year-end 2008). In addition, 25 cumulative preference shares have been issued to Stichting Preferente Aandelen KAS BANK. Most of the ordinary shares in the company’s issued capital (approximately 99.5% as at year-end 2009) are managed and administered by KAS BANK Registrar’s Office, which has issued the same number of depositary receipts for shares in exchange. The nominal value of KAS BANK shares and depositary receipts is one euro (€1.00). Each share and depositary receipt entitles the holder to cast one vote. No special controlling rights attach to the shares or depositary receipts. No voting rights attach to KAS BANK shares and depositary receipts held by the company itself.
Financial reporting
The company’s financial statements are examined by external auditors appointed by the General Meeting of Shareholders. The financial statements are drawn up by the Managing Board and are presented, after the above-mentioned audit and approval by the Supervisory Board, to the General Meeting of Shareholders for adoption and to the Employees‘ Council for discussion. Simultaneously with the presentation of the financial statements to the General Meeting of Shareholders, the Managing Board submits a written report on the course of affairs of the company and its management. The meeting of the Supervisory Board at which the financial statements are discussed is attended by the external auditors.
At the Annual General Meeting of Shareholders, the Managing Board renders account to the capital providers for its management in the past financial year and the Supervisory Board renders account for its supervision.
The motion at the General Meeting to approve the annual accounts is followed by a motion that, with respect to the financial statements and related matters dealt with by the General Meeting, the Managing Board be discharged of liability for its management and the Supervisory Board of liability for its supervision in the past financial year.
Amendment of the Articles of Association
Resolutions amending the company’s Articles of Association, which must be jointly proposed by the Supervisory Board and the Managing Board, require a General Meeting of Shareholders at which at least two-thirds of the issued share capital is represented. If the required share capital is not represented at the meeting, a new meeting will be convened, to be held not less than three and not more than five weeks after the first meeting, at which a resolution can be passed regardless of the represented share capital. The notice of the meeting will state ‚Amendment of the Articles‘ as the business of the meeting and a copy of the proposed amendment will be laid open for inspection at the company’s office and copies made available free of charge.
KAS BANK’s anti-takeover defences
Stichting Preferente Aandelen KAS BANK (KAS BANK Registrar’s Office for preference shares)
The object of Stichting Preferente Aandelen KAS BANK (Registrar’s Office) is to protect the interests of the company, the enterprise associated therewith and all stakeholders, including safeguarding against influences which might impair the independence, continuity and/or identity of the company and the enterprise. A right has been granted to the Registrar’s Office to subscribe for cumulative preference shares in the capital of the company up to a nominal amount corresponding to 50% of the nominal value of the capital in the form of ordinary shares in issue at the time of subscription for those shares. This right (call option) will be exercised by the Registrar’s Office at the discretion of its Executive Committee, on such grounds as the existence of (threatened) hostile intent or danger to the independence, continuity or identity of the company. The Registrar’s Office cannot be compelled to subscribe for preference shares (no put option).
The Executive Committee of the Registrar’s Office consists of three independent members: Messrs. H.G. Eijgenhuijsen (chairman), R.A.L. Verstraeten and A.H.G. Rinnooy Kan. The members of the Executive Committee are appointed by the Executive Committee itself, in consultation with the Managing Board and Supervisory Board of the company.
A list of the past and present posts held by members of the Executive Committee of the Registrar’s Office which may be relevant to the performance of their duties is available for inspection by shareholders and depositary receipt holders at the company’s offices.